CD30-induced signaling is absent in Hodgkin's cells but present in anaplastic large cell lymphoma cells
- PMID: 18187570
- PMCID: PMC2312360
- DOI: 10.2353/ajpath.2008.070858
CD30-induced signaling is absent in Hodgkin's cells but present in anaplastic large cell lymphoma cells
Abstract
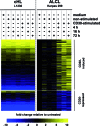
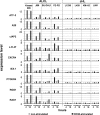
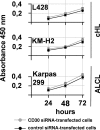
High CD30 expression in classical Hodgkin's lymphoma and anaplastic large cell lymphoma (ALCL) suggests an important pathogenic role of this cytokine receptor. To test this hypothesis, we investigated CD30 signaling in Hodgkin's and ALCL cell lines by different approaches: 1) CD30 stimulation, 2) CD30 down-regulation, and 3) a combination of both. The effects were determined at the RNA (microarray and real-time quantitative RT-PCR), protein (electrophoretic mobility shift analysis, immunoblot, and flow cytometry), and cellular/functional (proliferation and apoptosis) levels. We demonstrate that Hodgkin's cells are virtually CD30 unresponsive. Neither CD30 stimulation nor CD30 silencing of Hodgkin's cells had any significant effect. In contrast, CD30 stimulation of ALCL cells activated nuclear transcription factor-kappaB (NF-kappaB), induced major transcriptional changes, and decreased proliferation. These effects could be abrogated by down-regulation of CD30. Stimulation of CD30 in ALCL cells, stably transfected with a dominant-negative NF-kappaB inhibitor, induced pronounced caspase activation and massive apoptosis. Our data indicate that 1) CD30 signaling is not effective in Hodgkin's cell lines but is effective in ALCL cell lines, 2) CD30 is probably not significantly involved in the pathogenesis of classical Hodgkin's lymphoma, and 3) CD30 stimulation triggers two competing effects in ALCL cells, namely activation of caspases and NF-kappaB-mediated survival. These data suggest that CD30-targeted therapy in ALCL should be combined with NF-kappaB inhibitors to induce effective cell killing.
Figures


Similar articles
-
TRAF1 is involved in the classical NF-kappaB activation and CD30-induced alternative activity in Hodgkin's lymphoma cells.Mol Immunol. 2009 Aug;46(13):2441-8. doi: 10.1016/j.molimm.2009.05.178. Epub 2009 Jun 21. Mol Immunol. 2009. PMID: 19540595
-
mRNA expression patterns indicate CD30 mediated activation of different apoptosis pathways in anaplastic large cell lymphoma but not in Hodgkin's lymphoma.Leuk Res. 2006 Mar;30(3):343-8. doi: 10.1016/j.leukres.2005.08.010. Epub 2005 Sep 29. Leuk Res. 2006. PMID: 16198418
-
Common features and differences in the transcriptome of large cell anaplastic lymphoma and classical Hodgkin's lymphoma.Haematologica. 2006 May;91(5):596-604. Haematologica. 2006. PMID: 16670065
-
CD30 as a therapeutic target for lymphoma.BioDrugs. 2014 Apr;28(2):181-209. doi: 10.1007/s40259-013-0068-8. BioDrugs. 2014. PMID: 24043362 Review.
-
Hodgkin's lymphoma: the role of cell surface receptors in regulation of tumor cell fate.Exp Oncol. 2010 Dec;32(4):214-23. Exp Oncol. 2010. PMID: 21270747 Review.
Cited by
-
Tumor suppressor genes are larger than apoptosis-effector genes and have more regions of active chromatin: Connection to a stochastic paradigm for sequential gene expression programs.Cell Cycle. 2015 Aug 3;14(15):2494-500. doi: 10.1080/15384101.2015.1044179. Epub 2015 May 6. Cell Cycle. 2015. PMID: 25945879 Free PMC article.
-
CD30+ lymphoproliferative disorders.Haematologica. 2010 Oct;95(10):1627-30. doi: 10.3324/haematol.2010.029256. Haematologica. 2010. PMID: 20884717 Free PMC article. No abstract available.
-
Molecular genetics of peripheral T-cell lymphomas.Int J Hematol. 2014 Mar;99(3):219-26. doi: 10.1007/s12185-014-1522-1. Epub 2014 Jan 31. Int J Hematol. 2014. PMID: 24481943 Review.
-
Immunotherapy of CD30-expressing lymphoma using a highly stable ssDNA aptamer.Biomaterials. 2013 Nov;34(35):8909-17. doi: 10.1016/j.biomaterials.2013.07.099. Epub 2013 Aug 19. Biomaterials. 2013. PMID: 23968853 Free PMC article.
-
The biology of Hodgkin's lymphoma.Nat Rev Cancer. 2009 Jan;9(1):15-27. doi: 10.1038/nrc2542. Epub 2008 Dec 11. Nat Rev Cancer. 2009. PMID: 19078975 Review.
References
-
- Chiarle R, Podda A, Prolla G, Gong J, Thorbecke GJ, Inghirami G. CD30 in normal and neoplastic cells. Clin Immunol. 1999;90:157–164. - PubMed
-
- Doronina SO, Toki BE, Torgov MY, Mendelsohn BA, Cerveny CG, Chace DF, DeBlanc RL, Gearing RP, Bovee TD, Siegall CB, Francisco JA, Wahl AF, Meyer DL, Senter PD. Development of potent monoclonal antibody auristatin conjugates for cancer therapy. Nat Biotechnol. 2003;21:778–784. - PubMed
-
- Wendtner CM, Schmitt B, Gruss HJ, Druker BJ, Emmerich B, Goodwin RG, Hallek M. CD30 ligand signal transduction involves activation of a tyrosine kinase and of mitogen-activated protein kinase in a Hodgkin’s lymphoma cell line. Cancer Res. 1995;55:4157–4161. - PubMed
-
- Hübinger G, Muller E, Scheffrahn I, Schneider C, Hildt E, Singer BB, Sigg I, Graf J, Bergmann L. CD30-mediated cell cycle arrest associated with induced expression of p21(CIP1/WAF1) in the anaplastic large cell lymphoma cell line Karpas 299. Oncogene. 2001;20:590–598. - PubMed
-
- Levi E, Pfeifer WM, Kadin ME. CD30-activation-mediated growth inhibition of anaplastic large-cell lymphoma cell lines: apoptosis or cell-cycle arrest? Blood. 2001;98:1630–1632. - PubMed
Publication types
MeSH terms
Substances
LinkOut - more resources
Full Text Sources
Medical

