. 2008 Feb;118(2):583-96.
doi: 10.1172/JCI30375.

Role of Gas6 in erythropoiesis and anemia in mice

Affiliations

Role of Gas6 in erythropoiesis and anemia in mice

Anne Angelillo-Scherrer et al. J Clin Invest. 2008 Feb.

Abstract

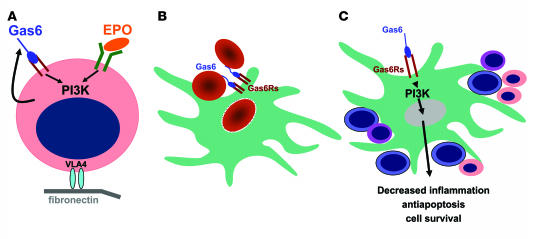
Many patients with anemia fail to respond to treatment with erythropoietin (Epo), a commonly used hormone that stimulates erythroid progenitor production and maturation by human BM or by murine spleen. The protein product of growth arrest-specific gene 6 (Gas6) is important for cell survival across several cell types, but its precise physiological role remains largely enigmatic. Here, we report that murine erythroblasts released Gas6 in response to Epo and that Gas6 enhanced Epo receptor signaling by activating the serine-threonine kinase Akt in these cells. In the absence of Gas6, erythroid progenitors and erythroblasts were hyporesponsive to the survival activity of Epo and failed to restore hematocrit levels in response to anemia. In addition, Gas6 may influence erythropoiesis via paracrine erythroblast-independent mechanisms involving macrophages. When mice with acute anemia were treated with Gas6, the protein normalized hematocrit levels without causing undesired erythrocytosis. In a transgenic mouse model of chronic anemia caused by insufficient Epo production, Gas6 synergized with Epo in restoring hematocrit levels. These findings may have implications for the treatment of patients with anemia who fail to adequately respond to Epo.


Figures

Figure 1
Figure 1. Defects in the erythroid lineage of WT and Gas6–/– mice.
(A and B) Reduced number of erythroid progenitors in fetal liver of Gas6–/– mice, analyzed as the number of BFU-Es (A) or CFU-Es (B). n = 6 per group. *P < 0.05. (C and D) Reduced percentage of Ter-119+ nucleated cells (erythroblasts) in adult BM (C; *P = 0.02) and spleen (D; *P < 0.02) in Gas6–/– mice. The erythroblasts were quantified as the percent of all nucleated cells by flow cytometry. n = 9 per group. (E and F) Reduced number of erythroid progenitors in the BM of adult Gas6–/– mice, analyzed as the number of BFU-Es (E) or CFU-Es (F). n = 8 per group. *P < 0.05. Values are mean ± SEM.
Figure 2
Figure 2. Senescent rbc engulfment by WT and Gas6–/– macrophages.
WT and Gas6–/– mouse rbc were treated with PHZ to expose phosphatidylserine on their surface and then incubated with primary adherent BM-derived macrophages. (A and B) Macrophages in phase-contrast illumination are indicated by arrowheads; engulfed rbc are denoted by arrows. Phagocytosis was impaired in Gas6–/– mice (B) compared with WT mice (A). Scale bars: 20 μm. (C) The number of macrophages with 3 or more internalized rbc was reduced in Gas6–/– mice compared with WT mice (n = 250; mean ± SEM; *P = 0.001). Data were reproduced in 100% C57BL/6 background (not shown).
Figure 3
Figure 3. Erythropoietic response to acute anemia in WT (black lines) and Gas6–/– (red lines) mice.
P values above the graphs denote overall genotypic difference during the entire period of analysis, as analyzed by ANOVA for repeated measurement statistics. *P < 0.05, standard t test. (AD) Impaired erythropoiesis in Gas6–/– compared with WT mice in response to PHZ-induced hemolytic anemia. (A and B) Hematocrit levels (A) and reticulocyte indices (B) after 2 PHZ injections on days 0 and 1 (n = 8). Data were reproduced in 100% C57BL/6 background (Supplemental Figure 1). (C and D) Impaired erythropoiesis in Gas6–/– mice in response to autoimmune hemolytic anemia, induced by intraperitoneal injection of the 34-3C anti-mouse rbc monoclonal antibody (200 μg on day 0). (C) Hematocrit levels. (D) Reticulocyte indices (n = 8). (E) Impaired erythropoiesis in Gas6–/– splenectomized mice in response to injections of PHZ injections on days 0 and 1 (n = 6). (F) Hematocrit levels in Gas6–/– and WT mice after PHZ injections on days 0, 1 and 2 (n = 6). A hematocrit value of 11% (the lowest detectable hematocrit level in preterminal mice) was assigned to the mice that died in the course of the experiment. Values are mean ± SEM.
Figure 4
Figure 4. Expression of Gas6 and Gas6Rs in erythroblasts.
(A) Western blot analysis of Axl and Mertk in spleen erythroblasts isolated from WT, Tyro3–/–, Axl–/–, and Mertkkd mice. Equal amounts of protein cell lysates were loaded per well. (B) Erythropoiesis of Tyro3–/–, Axl–/– or Mertkkd mice in response to PHZ. Overall genotypic differences versus WT (after Dunnett’s correction for multiple testing) were as follows: Tyro3–/–, P = 0.49 (n = 18); Axl–/–, P = 0.007 (n = 9); Mertkkd, P = 0.97 (n = 5). (C) WT and Axl–/– mice were subjected to PHZ-induced hemolytic anemia (injections of a half dose of PHZ on days 0 and 1) and treated with saline or rGas6 (2 μg daily intraperitoneally). P < 0.05, Axl–/– and Axl–/– plus rGas6 versus WT; P > 0.05, Axl–/– versus Axl–/– plus rGas6.
Figure 5
Figure 5. Release of Gas6 from erythroblasts in response to Epo.
Western blot analysis showing increased levels of Gas6 in cellular extracts and medium conditioned by UT7 human erythroid cells in response to 4 h stimulation with various concentrations of Epo. Total actin levels confirm the equal loading of cell protein extracts in each lane. Lanes showing Gas6 in cellular extracts were run on the same gel but were noncontiguous, as indicated by black lines.
Figure 6
Figure 6. Impaired Epo survival response of Gas6–/– erythroblasts.
(A and B) TUNEL staining of spleen 3 days after induction of hemolytic anemia by PHZ. Black staining with TUNEL denotes localized apoptotic cells in WT (A) and Gas6–/– (B) spleen. F, follicle; RP, red pulp. Scale bars: 100 μm. (C) TUNEL assay of WT and Gas6–/– erythroblasts isolated 6 days after PHZ injection. Cells were cultured for 16 h in the presence or absence of recombinant human Epo at the indicated concentrations. The TUNEL assay was quantified by flow cytometry (n = 4); results are expressed as the percentage of apoptotic erythroblasts, cells double-stained for TUNEL and Ter-119. (D) Dead cell count of splenic erythroblasts (Trypan blue+ cells) collected on day 6 after PHZ injection and maintained in culture for 24 h in the presence or absence of Epo (1.5 IU/ml) or Epo plus human rGas6 (400 ng/ml). n = 8 per group. Values are mean ± SEM. *P < 0.05 versus WT.
Figure 7
Figure 7. Gas6 is required for adhesion of erythroblasts.
(A) Adherence of WT versus Gas6–/– erythroblasts to fibronectin (n = 6), a mechanism essential for proliferation, survival, and expansion of these cells. The adhesion defect of Gas6–/– erythroblasts was corrected by the addition of rGas6. (B) Survival response to Epo of WT and Gas6–/– erythroblasts adherent to fibronectin (n = 3). Apoptotic adherent erythroblasts stained by DAPI were counted as cells with nuclear fragmentation. (C) Expression of VLA4 and Ter-119 in WT (n = 9) and Gas6–/– (n = 8) spleen determined by flow cytometry. VLA4 expression is proportional to Ter-119 expression. (D) Adherence of WT versus Gas6–/– erythroblasts to fibronectin in the presence of 0.9% NaCl (vehicle), LY294002, or anti-VLA4 antibody (2 μg/106 cells) (n = 6). Values are mean ± SEM. *P < 0.05. Data were reproduced in 100% C57BL/6 background (not shown).
Figure 8
Figure 8. Epo signaling in WT and Gas6–/– erythroblasts.
(A and B) Western blot analysis of erythroblasts isolated from spleen 6 days after PHZ treatment from WT and Gas6–/– mice. (A) Total and tyrosine-phosphorylated (pTyr) EpoR expression in WT and Gas6–/– erythroblasts. (B) Akt phosphorylation in response to Gas6 alone (400 ng/ml), Epo alone (10 IU/ml), or a combination of both. Densitometric quantification of the amount of tyrosine-phosphorylated EpoR and total EpoR revealed a comparable ratio of pTyr-EpoR to EpoR in both genotypes (not shown).
Figure 9
Figure 9. Relative cytokine levels in plasma and BM-derived macrophage releasate in WT and Gas6–/– mice.
A cytokine antibody array was performed in a pool of plasma of 8 mice in steady-state condition (A) and a pool of releasate of 8 macrophage culture samples (B). Relative cytokine expression is shown in AU. Cytokines known to inhibit erythropoiesis are indicated in red. 1, Axl; 2, B lymphocyte chemoattractant; 3, CD40; 4, CD80L; 5, CD80T; 6, cytokine responsive gene–2; 7, cutaneous T cell–attracting chemokine; 8, CXC–chemokine ligand–16; 9, eotaxin; 10, eotaxin-2; 11, FasL; 12, fractalkine; 13, G-CSF; 14, GM-CSF; 15, IFN-γ; 16, IGF-binding protein 3 (IGFBP-3); 17, IGFBP-5; 18, IGFBP-6; 19, IL-10; 20, IL-12p40/p70; 21, IL-12p70; 22, IL-13; 23, IL-17; 24, IL-1α; 25, IL-1β; 26, IL-2; 27, IL-3; 28, IL-3Rβ; 29, IL-4; 30, IL-5; 31, IL-6; 32, IL-9; 33, mouse IL-8 ortholog (KC or Gro-alpha); 34, leptin; 35, leptin receptor; 36, LPS-induced CXC chemokine; 37, L-selectin; 38, lymphotactin; 39, monocyte chemotactic protein–1 (MCP1); 40, MCP5; 41, M-CSF; 42, monokine induced by IFNγ; 43, macrophage inflammatory protein 1α (MIP1α); 44, MIP1γ; 45, MIP2; 46, MIP3α; 47, MIP3β; 48, platelet factor 4; 49, P-selectin; 50, RANTES; 51, SCF; 52, SCF1α; 53, soluble TNF-receptor 1 (sTNF-R1); 54, sTNF-R2; 55, thymus activation regulated chemokine; 56, T cell activation gene 3; 57, thymus expressed chemokine; 58, tissue inhibitor of metalloproteinase 1; 59, TNF-α; 60, thrombopoietin; 61, VCAM-1; 62, VEGF.
Figure 10
Figure 10. Therapeutic potential of rGas6 in acute and chronic anemia.
(A and B) WT (A) and Gas6–/– mice (B) were subjected to PHZ induced hemolytic anemia (injections on day 0 and 1) and treated with saline (control), human rGas6 (2 μg daily intraperitoneally), recombinant human Epo (10 IU every second day intraperitoneally), or a combination of rGas6 and Epo. Overall genotypic differences relative to the control of the same genotype (calculated after Bonferroni correction for multiple testing) were as follows: rGas6-treated WT, P < 0.001; Epo-treated WT, P < 0.001; rGas6-treated Gas6–/–, P = 0.004; Epo-treated Gas6–/–, P = 0.008; rGas6- and Epo-treated Gas6–/–, P < 0.001. (C) Hematocrit levels in transgenic Epo-TAgH mice, a model of stable chronic anemia, treated with rGas6 alone or in combination with Epo at the indicated doses (in μg and IU, respectively). Values are mean ± SEM (n = 6). *P < 0.05 versus control, standard t test.
Figure 11
Figure 11. Model summarizing the role of the Gas6 pathway in erythropoiesis.
(A) Gas6 released by erythroblasts in response to Epo interacts with Gas6R on the cell surface, leading to signaling for cell survival and possible cell proliferation, maturation, and differentiation, and enhances EpoR signaling by activating PI3K and its effector Akt in these cells (autocrine effect). In addition, Gas6 favors adhesion of erythroblasts to fibronectin via VLA4/α4β1 integrin activation. (B) Gas6 acts as a bridging molecule between senescent rbc and Gas6Rs, driving engulfment of the bound senescent rbc. (C) Interaction of Gas6 and Gas6Rs downregulates the release of erythroid-inhibitory factors from macrophages in the erythroblastic island.

References

    1. Weatherall D.J., Provan A.B. Red cells I: inherited anaemias. Lancet. 2000;355:1169–1175. - PubMed
    1. Richmond T.D., Chohan M., Barber D.L. Turning cells red: signal transduction mediated by erythropoietin. Trends Cell Biol. 2005;15:146–155. - PubMed
    1. Koury M.J., Bondurant M.C. Erythropoietin retards DNA breakdown and prevents programmed death in erythroid progenitor cells. Science. 1990;248:378–381. - PubMed
    1. Krystal G. A simple microassay for erythropoietin based on 3H-thymidine incorporation into spleen cells from phenylhydrazine treated mice. Exp. Hematol. 1983;11:649–660. - PubMed
    1. Blumenauer B., Cranney A., Clinch J., Tugwell P. Quality of life in patients with rheumatoid arthritis: which drugs might make a difference? Pharmacoeconomics. 2003;21:927–940. - PubMed

Publication types

MeSH terms