. 2008 Apr;70(3):677-712.
doi: 10.1007/s11538-007-9274-1. Epub 2008 Jan 11.

A computational study of the development of epithelial acini: I. Sufficient conditions for the formation of a hollow structure

Affiliations

A computational study of the development of epithelial acini: I. Sufficient conditions for the formation of a hollow structure

Katarzyna A Rejniak et al. Bull Math Biol. 2008 Apr.

Abstract

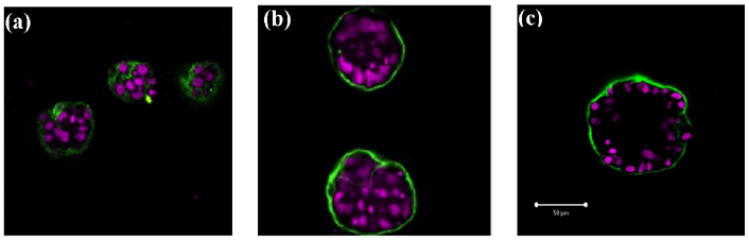
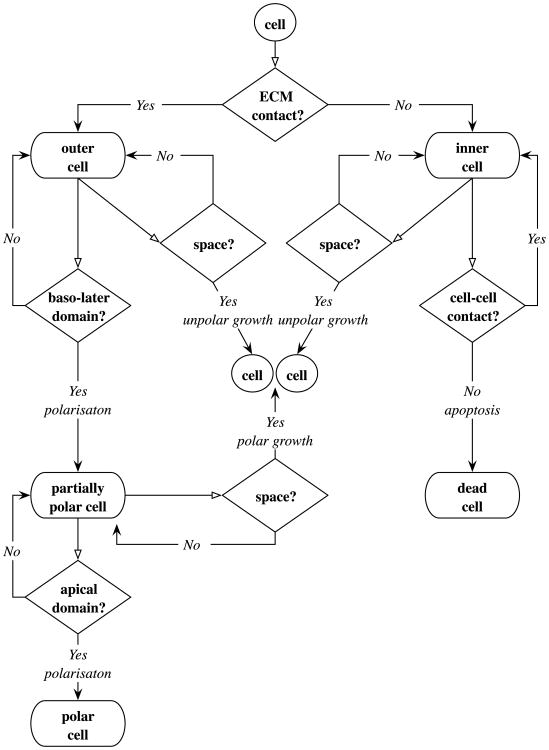
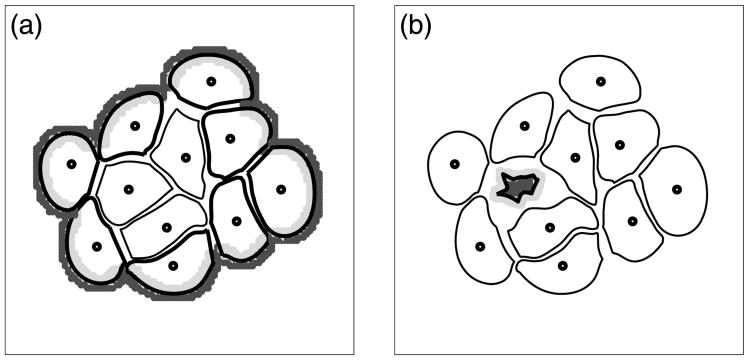
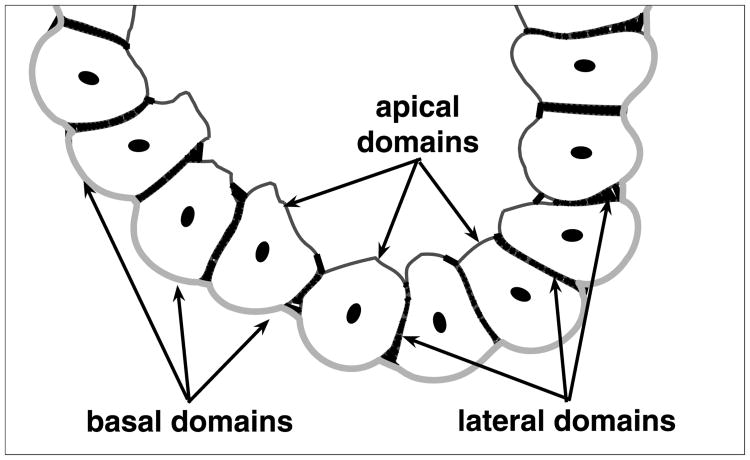
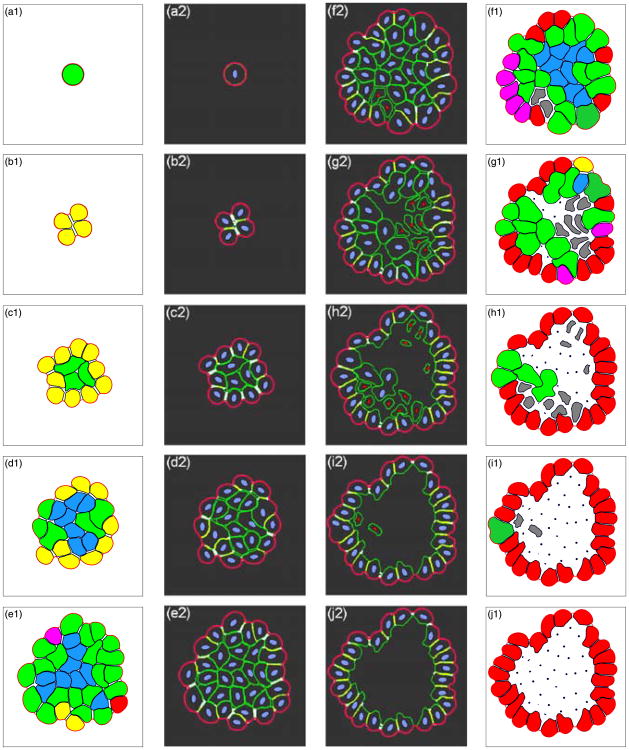
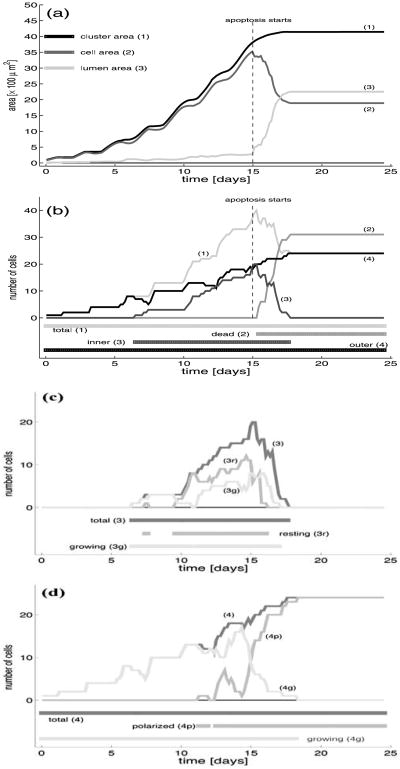
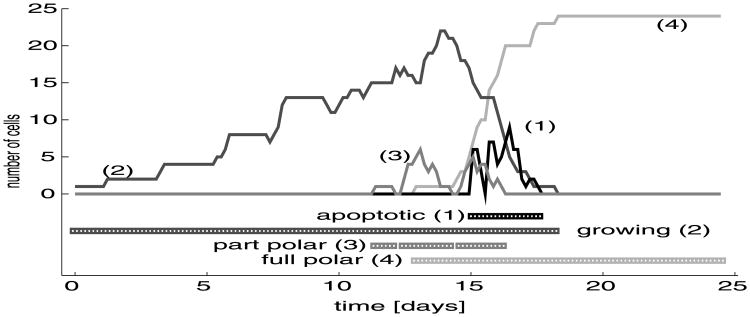
Normal hollow epithelial acini are 3-dimensional culture structures that resemble the architecture and functions of normal breast glands and lobules. This experimental model enables in vitro investigations of genotypic and molecular abnormalities associated with epithelial cancers. However, the way in which the acinar structure is formed is not yet completely understood. Gaining more information about consecutive stages of acini development-starting from a single cell that gives rise to a cluster of randomly oriented cells, followed by cell differentiation that leads to a layer of polarised cells enclosing the hollow lumen-will provide insight into the transformations of eukaryotic cells that are necessary for their successful arrangement into an epithelium. In this paper, we introduce a two-dimensional single-cell-based model representing the cross section of a typical acinus. Using this model, we investigate mechanisms that lead to the unpolarised cell growth, cell polarisation, stabilisation of the acinar structure and maintenance of the hollow lumen and discuss the sufficient conditions for each stage of acinar formation. In the follow-up paper (Rejniak and Anderson, A computational study of the development of epithelial acini. II. Necessary conditions for structure and lumen stability), we investigate what morphological changes are observable in the growing acini when some assumptions of this model are relaxed.


Figures

Fig. 1
Fig. 1
Three stages of acinar development of mammary epithelial cell line MCF-10A-HER2 cultured on Matrigel: (a) small clusters of unpolarised cells, 8th day; (b) 16th day, the outer layer contains polarised epithelial cells, more pronounced in the upper acinus; (c) the final acinar configuration consisting of a single layer of polarised cells enclosing the hollow lumen, 20th day. Courtesy of Shizhen Emily Wang, the Vanderbilt Integrative Cancer Biology Center (ViCBC), unpublished.
Fig. 2
Fig. 2
Flowchart of phenotypically different subpopulations of resting cells—outer, inner, partially polarised, fully polarised, dead; and the associated cell life cycle processes—growth, polarisation and apoptotic death. Cells fate depends on interactions with other cells and on cues sensed from cell microenvironment. For instance, an outer cell needs to inspect its local environment to determine if there is sufficient free space to grow. If not, it inspects connections with neighbouring cells to identify the baso-lateral membrane domains that will change the cell phenotype to partially polar. However, if the baso-lateral domains cannot be recognised, the cell remains in its current state.
Fig. 3
Fig. 3
The cell plasma membrane is modelled as a collection of linear springs of two kinds: adjacent links, that join every pair of neighbouring boundary points: Xl with Xl+1, and Xl+1 with Xl+2 (solid lines); and supportive links that join alternating boundary points: Xl and Xl+2 (dashed lines).
Fig. 4
Fig. 4
(a) The area of a local cell microenvironment: inside (light grey) and outside (dark grey) the cell; (b) membrane receptors expressing the contact between cells and the extracellular matrix (black dots on the cell boundary) and contact between separate cells (thin lines indicating cell–cell adhesive connections).
Fig. 5
Fig. 5
Areas of fluid transport (from dark grey to light grey) within the local environments of (a) several growing cells located on the boundary of the cell cluster; (b) one apoptotic cell located inside the cell cluster.
Fig. 6
Fig. 6
Main phases of cell proliferation: (a) cell ready to grow, (b) doubling of the cell area, (c) formation of the contractile ring (dashed lines), (d) cellular division into two daughter cells.
Fig. 7
Fig. 7
Orientation of the axes of cell division in unpolarised (a) and polarised (b) cells, shown in dark grey with two daughter nuclei (dots), the cell longest axis (thin lines passing through daughter nuclei) and the axis of cell division (thick dashed line) that is orthogonal to the cell longest axis.
Fig. 8
Fig. 8
Four stages (a)–(d) of cell apoptotic death showing gradual reduction of the cell area, changes in the cell shape and shrinkage of the cell membrane.
Fig. 9
Fig. 9
Three kinds of cell membrane domains: basal (thick grey lines) in direct contact with the extracellular matrix; lateral (thick black lines) between two neighbouring outer cells; apical (thin black lines) facing the hollow lumen.
Fig. 10
Fig. 10
Development of a typical epithelial acinus. Left and right columns show different subpopulations of epithelial cells: green—growing, yellow—resting outer, blue—resting inner, pink—partially polarised, red—fully polarised, grey—apoptotic, black points—dead. Two middle columns show inter- and intra-cellular elements: blue—nuclei of living cells, red—nuclei of apoptotic cells, green—cell membranes, white—lateral membrane domains, yellow—tight junctions, pink—basal membrane domains. A hollow epithelial acinus develops from a single cell (a) that upon consecutive divisions gives rise to a small cluster of cells (b), further growth leads to the formation of phenotypes of outer and inner cells (c)–(d), due to interactions with neighbouring cells the phenotypes of partially and fully polarised cells emerge (e), first apoptotic cells arise in the neighbourhood of fully polarised cells (f), centrally located inner cells die due to lost of adhesive support from neighbouring cells (g)–(h), the growth of fully polarised cells is suppressed that leads to structure stabilisation (i)–(j). The time points shown correspond to real time: (a) 9.25 hours, 13 μm in diameter; (b) 3.85 days, 21 μm; (c) 8 days, 38 μm; (d) 10.75 days, 50 μm; (e) 13.85 days, 64 μm; (f) 15 days, 69 μm; (g) 15.75 days, 71 μm; (h) 16.5 days, 72 μm; (i) 17.5 days, 72 μm; (j) 19.25 days, 72 μm in diameter. A supplementary movie is available online: http://www.maths.dundee.ac.uk/∼rejniak/BMBmovie.html.
Fig. 11
Fig. 11
(a) Dynamical changes in the total area of the cluster (1), the area of a subregion occupied by the living cells (2), and a subregion occupied by the lumen (3); (b) evolution of the total number of cells in the whole cluster (1), the accumulation of dead cells (2), the number of inner living cells (3), the number of outer cells (4); (c) evolution of the number of outer cells: (4) total, (4p) polarised, (4g) growing cells; (d) evolution of the number of inner cells: (3) total, (3r) resting, (3g) growing cells; horizontal lines below the graph indicate time intervals in which particular cell subpopulations are present in the system.
Fig. 12
Fig. 12
Evolution of four subpopulations of phenotypically distinct cells leading to the formation a hollow epithelial acinus: (1) apoptotic cells, (2) proliferating cells, (3) partially polarised cells, (4) fully polarised cells; horizontal lines below the graph indicate time intervals in which particular cell subpopulations are present in the whole system.
Fig. 13
Fig. 13
Distributions of times needed for completion of processes of cell growth (a), cell division (b), cell apoptosis (c) for 54 proliferating and 31 dying cells from the simulation in Fig. 10.
Fig. 14
Fig. 14
Four regions of distinct acinar development. Prolonged cell maturation together with early cell polarisation leads to small afunctional acini; fast proliferation with early cell polarisation results in degenerate mutants; coordination between cell maturation and initiation of polarisation leads to normal acini; if cell polarisation is initiated late, the acinar structures grow larger but look normal. The time needed to acquire a stable acinar structure varies: small acini stop growing very fast (14 days on average), normal and large acini need similar times (about 19 days on average), but for degenerate acini it takes longer to stabilise (23 days on average).
Fig. 15
Fig. 15
Different stages of acinar development. (a) Small acini—slow growth and early polarisation leads to growth arrest after about 14 days of the real time; (b) degenerate acini—very fast growth does not allow for full polarisation to be accommodated, so the acinar stabilisation is achieved after about 23 days; (c) large acini—fast growth and late polarisation result in round but large acini stabilising after about 19 days of their growth; (d) normal acini—coordination between the time of cell growth and cell polarisation leads to acinar stability after about 19 days of the real time. Dark grey cells represent fully polarised cells, black dots inside the lumen represent dead cells.
Fig. 16
Fig. 16
Adjustment of model parameters to match experimental data: A—steepness of the cell counts curve (1); B—maximal value of the cell counts curve (1); C—length of the pre-polarisation period, curve (3); D—steepness of the polarisation curve (3); E—length of the apoptotic period, curve (4); F—decrease in cell counts curve (1). All data are extracted from curves generated from the example simulation shown in Fig. 10.

References

    1. Alberts B, Johnson A, Lewis J, Raff M, Roberts K, Walter P. Molecular biology of the cell. 4th Garland Science; 2002.
    1. Anderson ARA. A hybrid mathematical model of solid tumour invasion: the importance of cell adhesion. Math Med Biol. 2005;22:163–186. - PubMed
    1. Anderson ARA, Weaver AM, Cummings PT, Quaranta V. Tumor morphology and phenotypic evolution driven by selective pressure from the microenvironment. Cell. 2006;127:905–915. - PubMed
    1. Ardens MJ, Wyllie AH. Apoptosis: mechanisms and roles in pathology. Int Rev Exp Pathol. 1991;32:223–254. - PubMed
    1. Bowen ID, Lockshin RA. Cell Death in Biology and Pathology. Kluwer Academic; Dordercht: 1981.

Publication types

MeSH terms

LinkOut - more resources