Review
. 2008 Apr;36(4):534-44.
doi: 10.1007/s10439-007-9429-0. Epub 2008 Jan 11.

Blood cell interactions and segregation in flow

Affiliations
Review

Blood cell interactions and segregation in flow

Lance L Munn et al. Ann Biomed Eng. 2008 Apr.

Abstract

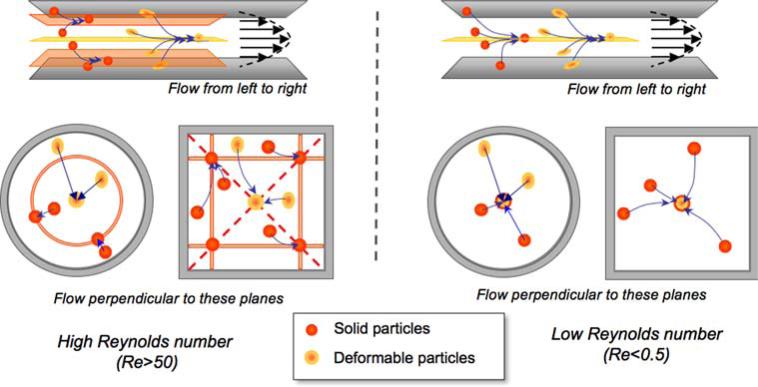
For more than a century, pioneering researchers have been using novel experimental and computational approaches to probe the mysteries of blood flow. Thanks to their efforts, we know that blood cells generally prefer to migrate to the axis of flow, that red and white cells segregate in flow, and that cell deformability and their tendency to reversibly aggregate contribute to the non-Newtonian nature of this unique fluid. All of these properties have beneficial physiological consequences, allowing blood to perform a variety of critical functions. Our current understanding of these unusual flow properties of blood have been made possible by the ingenuity and diligence of a number of researchers, including Harry Goldsmith, who developed novel technologies to visualize and quantify the flow of blood at the level of individual cells. Here we summarize efforts in our lab to continue this tradition and to further our understanding of how blood cells interact with each other and with the blood vessel wall.


Figures

FIGURE 1
FIGURE 1
RBC rouleaux encourage leukocyte margination at postcapillary expansions. (a) Velocity field and cell positions at normalized times t = 0, 0.056, 0.333, 0.5, 0.667, and 0.944. Red blood cells are represented by different colors for tracking purposes; lighter shading of the WBC indicates that the cell is rolling on the wall. The initial stacked organization of the RBCs directly behind the WBC evolves naturally in the capillary (not shown). As the stack of cells exit the capillary, the parabolic flow profile causes the RBC rouleau to act as a lever, pushing the slower WBC toward the wall. The critical parameters are the size of the rouleau, the width of the expansion, and the ability of the cells to stay stacked long enough to force the cell to the wall. (b) The importance of the organization of the rouleaux becomes obvious when the RBC shape is changed from flat capsules to ellipsoids. In this case, the stack of RBCs quickly dissociates, and the leukocyte does not contact the wall. The plots c, d, e, and f show the fluctuations in the net force on the WBC in the x direction (Fx) and the WBC velocity, Vx. The velocity initially decreases dramatically as the cells enter the expansion and the RBCs push the WBC toward the wall; another dramatic speed change occurs as the WBC starts rolling through stochastic ligand–receptor binding (d) (reproduced with permission from Ref. 66).
FIGURE 2
FIGURE 2
Passing RBCs “bounce” rolling leukocytes against the endothelium. Our simulations estimate the forces as RBCs interact with rolling WBCs. The normal force is first negative (directed toward the surface) and then positive (directed away from the surface). By pushing the rolling cell against the endothelium, RBCs likely encourage penetration of microvilli through the glycocalyx and engagement of adhesion molecules. Note also that the tangential force is enhanced, encouraging rolling, except where adhesion molecule density is sufficiently high (reproduced with permission from Ref. 50).
FIGURE 3
FIGURE 3
(a) WBC adhesion affects flow resistance through 20 μm (left) and 40 μm (right) channels. Flow is from bottom to top. The hematocrit for each simulation is given at bottom, and the velocity profiles across the channel at various time points are shown at top. The WBC is the yellow disk, and the RBCs are the colored capsules; background color corresponds to the local fluid pressure and the small arrows correspond to the local fluid velocity. Note the build-up of pressure behind the rolling WBC (red color), which is greater at higher hematocrit and smaller channels. (b) Relationship between relative apparent viscosity and hematocrit. The solid lines represent the data from Ref. . Red represents the 40 μm tube and blue the 20 μm tube (reproduced with permission from Ref. 67).
FIGURE 4
FIGURE 4
Estimated pressure fluctuations on the endothelium in the skin of a mouse due to blood cells. A and B give the flow fields and cell positions at various times for 2 different simulations. Total time of 0.8 s is normalized to 1. The pressure field is represented by colors and the velocity field is represented by arrows. Panel A: Time sequence of three RBCs following a WBC into a larger venule is shown in a–e. Blue arrows in (a) give flow direction. Panel B: simulation of six RBCs following a WBC into the right branch with diverging flow. Normalized pressure, P, at the wall positions marked by the red arrows in Panels 2A(a) and 2B(a) are shown in Panels C and D, respectively. The blue letters a–e within the plots mark the times corresponding to the panels a–e in Panels A and B. Note the large fluctuation in pressure at the wall as the WBC passes, and then the RBCs pass. In D, the pressure at the stagnation point increases significantly as the cells approach (a–d). The increase in pressure near the end of the simulation is due to the flow resistance produced by the cells in the exit segments (reproduced with permission from Ref. 69).
FIGURE 5
FIGURE 5
Focal leaks cause hemoconcentration and flow diversion. In this computer simulation, plasma (a) or blood (b) flows through a simple vessel bifurcation from top to bottom. In (b) the colored capsules represent red blood cells. In both (a) and (b), the right hand daughter channel has multiple apertures that allow plasma leakage, while the left hand channel is impermeable. For the case (b), with red blood cells, the flow velocities are plotted in (d), with the colors corresponding to the locations noted in the map (c) (i.e., blue is at the inlet, orange is at the entrance to the left-hand branch, etc.). In (a) and (b) the plasma pressure coefficient [P = 2(ppex)/ρU2, where p is local pressure, pex is pressure at the exit, U is flow velocity, and ρ is density] is represented by the color gradient and the velocity field is represented by small arrows. In (d), the system starts with no cells, and the velocities evolve with time as RBCs enter the bifurcation. Note the diversion of flow from the right to the left channel as plasma leakage and hemoconcentration increase the resistance to flow through the right hand channel (reproduced with permission from Ref. 65).
FIGURE 6
FIGURE 6
Microfabricated device for enriching WBCs from whole blood. Flow is from top to bottom. Blood is drawn into a long, straight channel (dimensions: 70 μm wide × 10.3 μm high × 5.5 mm long). Because of the low aspect ratio of the channel, the natural tendency of WBCs to marginate is enhanced, and most WBCs move to the sides of the channel (the end of this long channel is pictured in a). Notice that the two WBCs in this segment are both flowing adjacent to the side walls. The margination channel then feeds into a bifurcation that skims off the WBCs (time course of a WBC being extracted is shown in panels b–f). With appropriate bifurcation angle and channel dimensions, the WBCs traveling near the walls are enriched 34-fold in a single pass (reproduced with permission from Ref. 62).
FIGURE 7
FIGURE 7
Equilibrium positions of spherical particles in flow depend on Reynolds number, particle stiffness, and conduit geometry. We adopt the following color convention in this paper: orange for deformable particles, red for stiff particles. At high Re (left hand side of the figure), stiff particles migrate away from the wall and away from the centerline, to a position approximately 40% away from the wall towards the center. The higher the Re, the closer to the wall is the equilibrium location. Round channels exhibit a ring of stiff particles at equidistance from the center, and rectangular geometries exhibit four distinct equilibrium positions in which stiff particles form trains., Deformable particles on the other hand, migrate towards the center. At low Re (right hand side of the figure), both stiff and deformable particles migrate towards the center of the channel.
FIGURE 8
FIGURE 8
Separation of deformable (orange) and stiff particles (red) at high Re (Re = 60, (a), (c), (e)), and low Re (Re = 0.2, (b), (d), (f)). Flow is into the plane of the figure; one of the sides of the square conduit is visible at left (checkered pattern). (a) And (b) show the initial configurations. Note that in (b), the stiff particles are initialized around the center only. (c) And (d) show the steady state configurations. (e) And (f) show the average cross-sectional distance (distance perpendicular to the direction of the flow), d, between the stiff particles (red line), deformable particle (orange line), and suspension (blue line). The particles traveled more than 10,000 times their diameter to reach steady state. The simulations required only 20 h on 5 CPUs.

References

    1. Bell GI. Models for the specific adhesion of cells to cells. Science. 1978;200:618–627. - PubMed
    1. Bishop JJ, Nance P, Popel AS, Intaglietta M, Johnson PC. Effect of erythrocyte aggregation on velocity profiles in venules. Am. J. Physiol. Heart Circ. Physiol. 2001;280:H222–H236. - PubMed
    1. Bishop JJ, Popel AS, Intaglietta M, Johnson PC. Effects of erythrocyte aggregation and venous network geometry on red blood cell axial migration. Am. J. Physiol. Heart Circ. Physiol. 2001;281:H939–H950. - PubMed
    1. Brown EB, Campbell RB, Tsuzuki Y, Xu L, Carmeliet P, Fukumura D, Jain RK. In vivo measurement of gene expression, angiogenesis and physiological function in tumors using multiphoton laser scanning microscopy. Nat. Med. 2001;7:864–868. - PubMed
    1. Butcher EC, Lewinsohn D, Duijvestijn A, Bargatze R, Wu N, Jalkanen S. Interactions between endothelial cells and leukocytes. J. Cell. Biochem. 1986;30:121–131. - PubMed

Publication types

LinkOut - more resources