. 2008 Feb 29;376(4):1076-90.
doi: 10.1016/j.jmb.2007.12.027. Epub 2007 Dec 23.

Point mutations in membrane proteins reshape energy landscape and populate different unfolding pathways

Affiliations

Point mutations in membrane proteins reshape energy landscape and populate different unfolding pathways

K Tanuj Sapra et al. J Mol Biol. .

Abstract

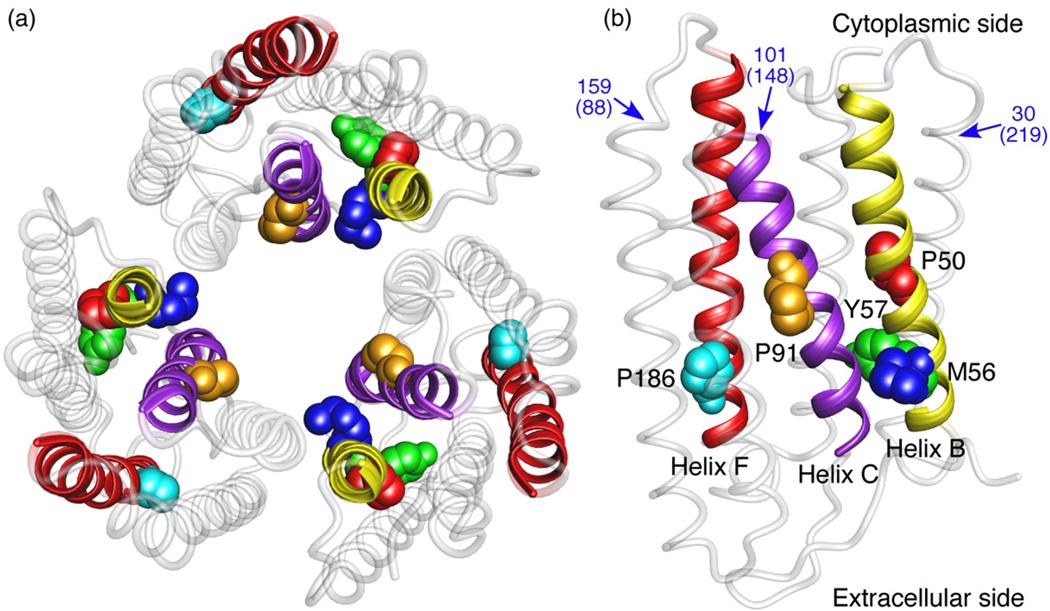
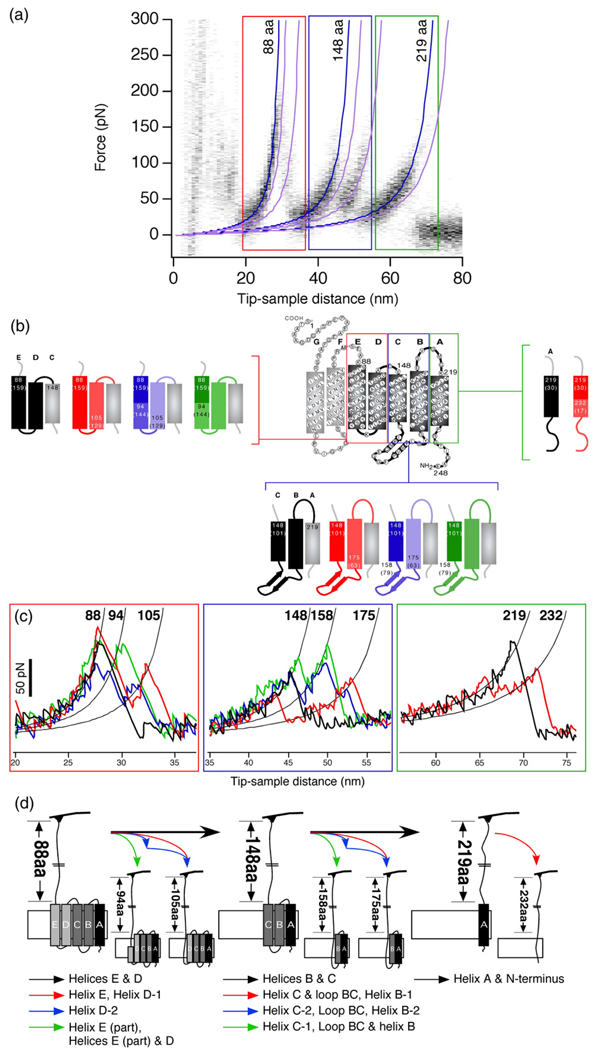
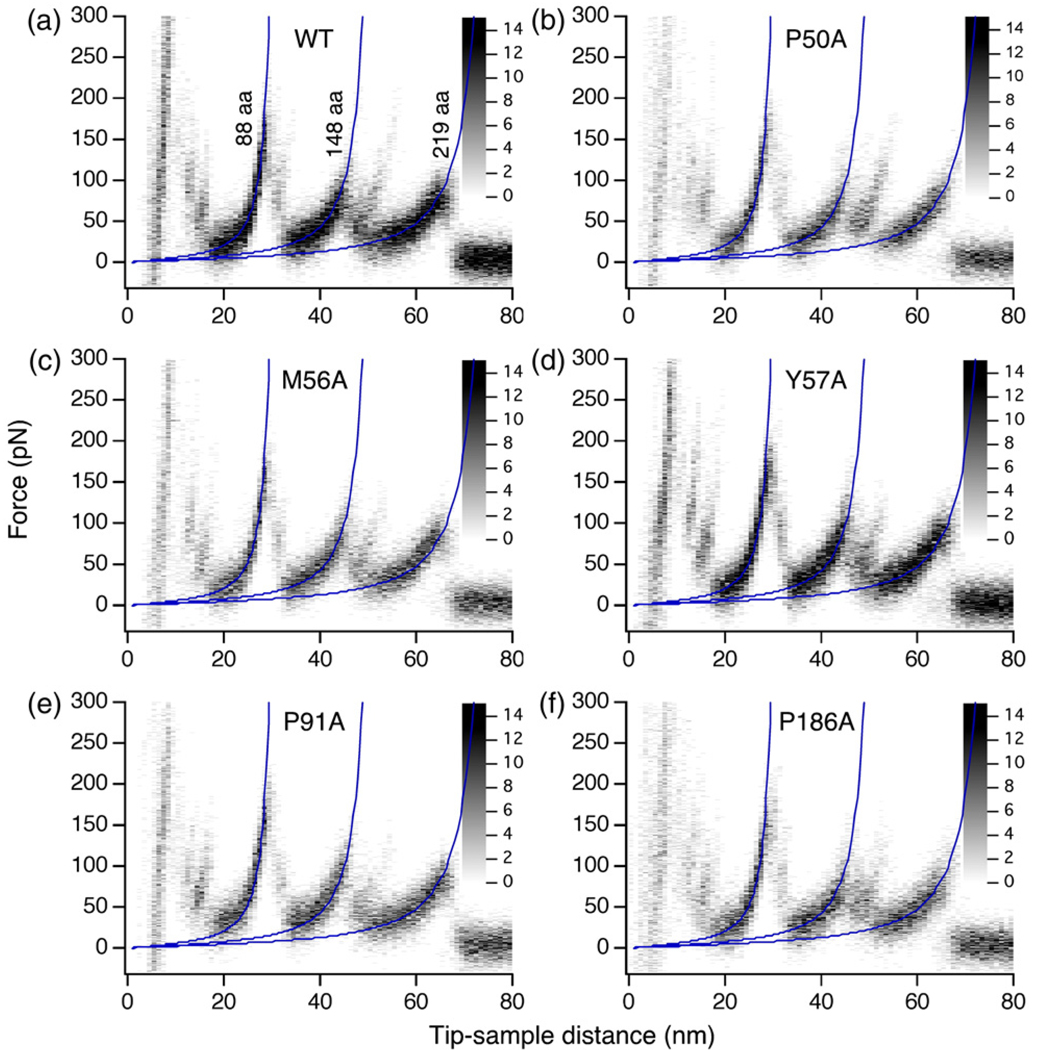
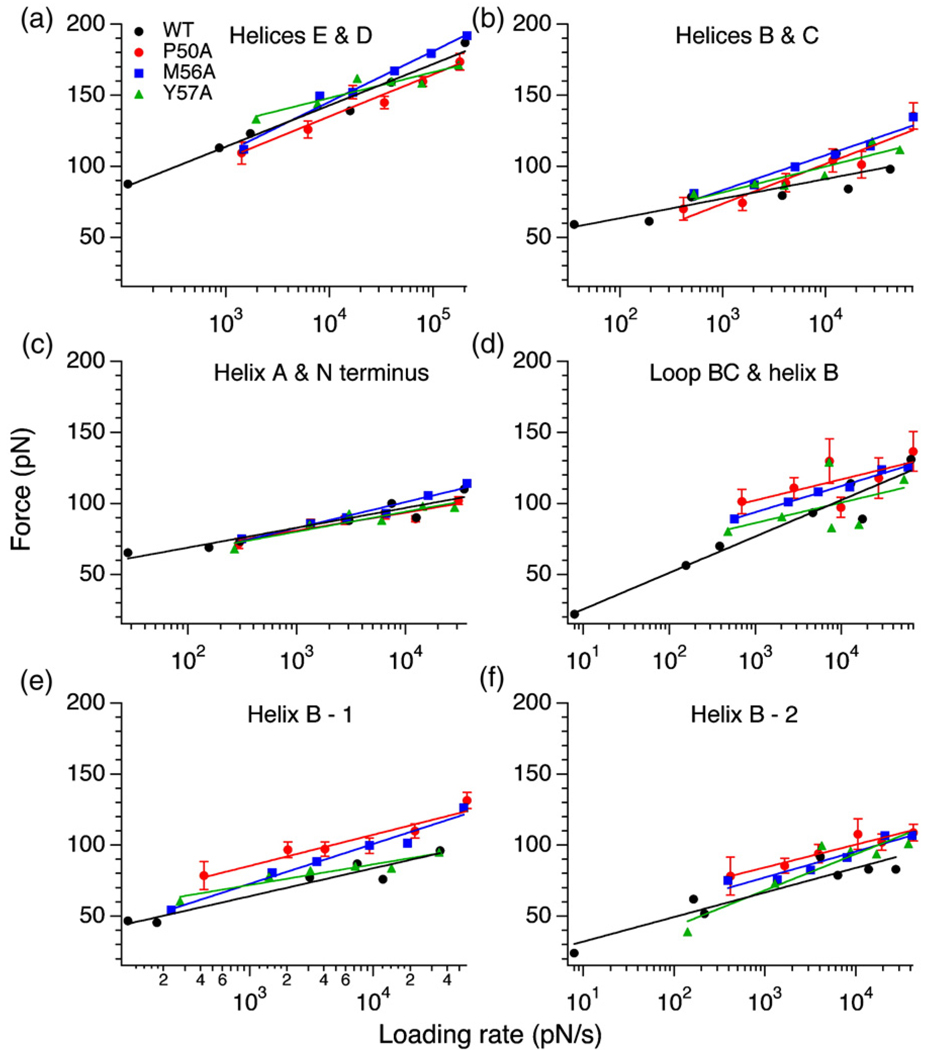
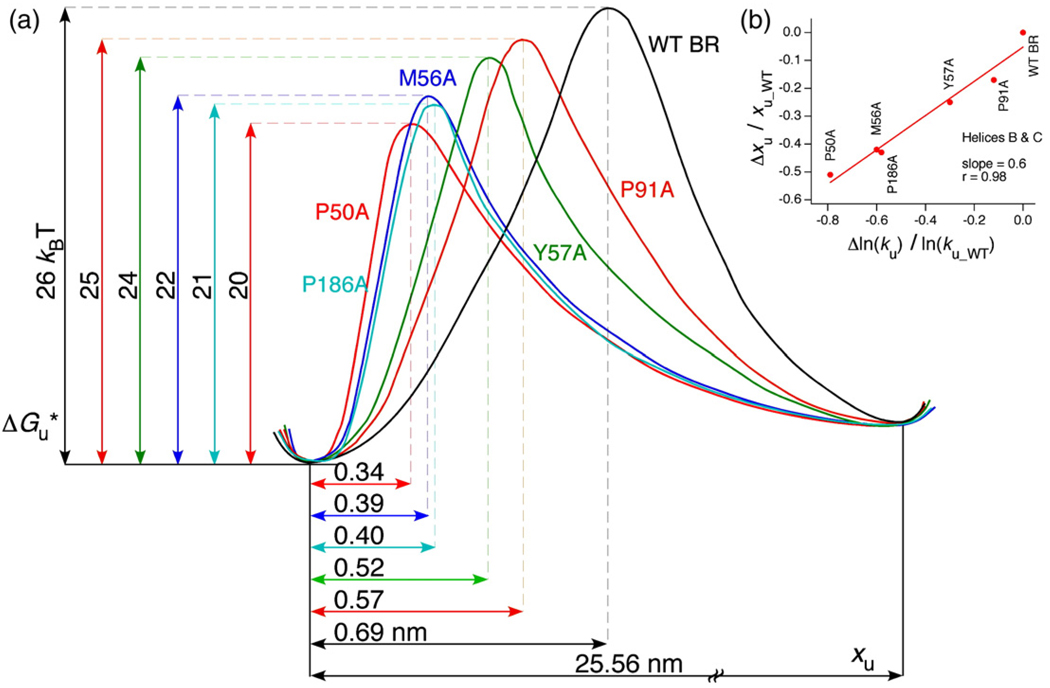
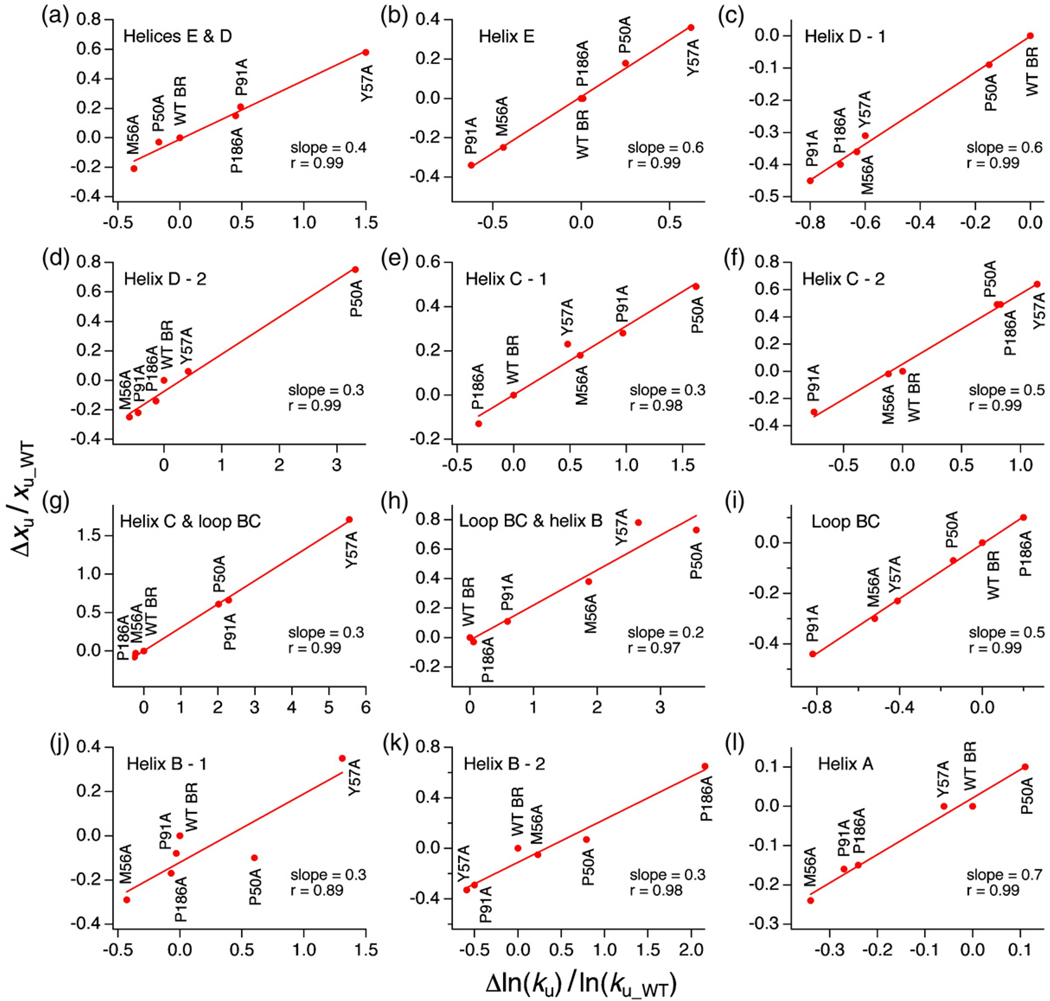
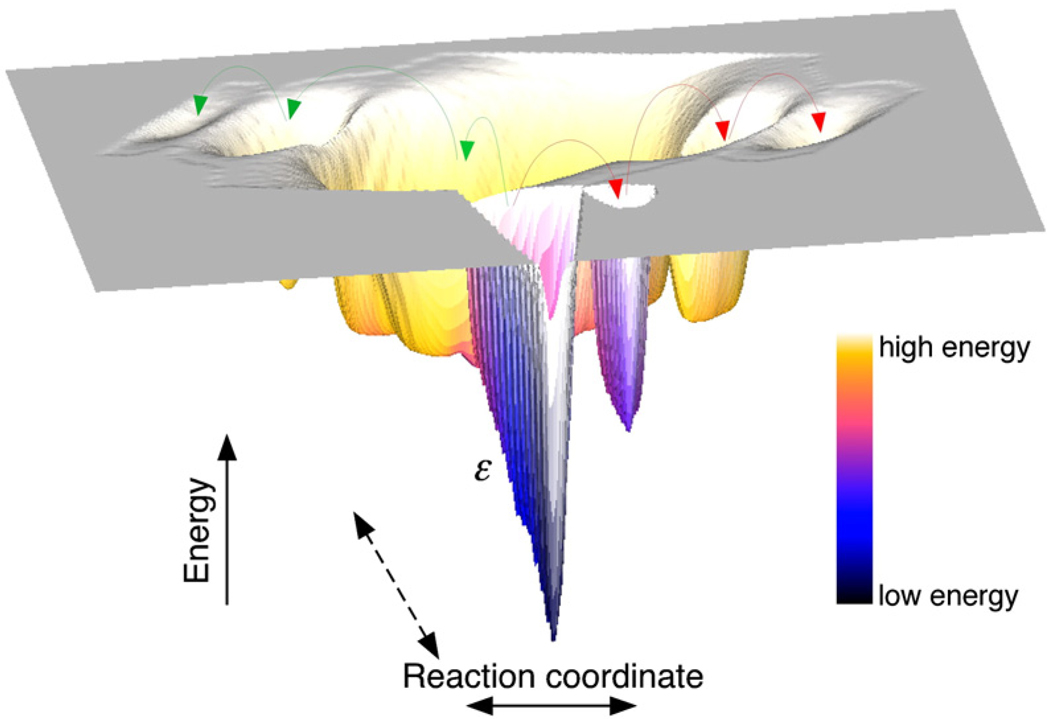
Using single-molecule force spectroscopy, we investigated the effect of single point mutations on the energy landscape and unfolding pathways of the transmembrane protein bacteriorhodopsin. We show that the unfolding energy barriers in the energy landscape of the membrane protein followed a simple two-state behavior and represent a manifestation of many converging unfolding pathways. Although the unfolding pathways of wild-type and mutant bacteriorhodopsin did not change, indicating the presence of same ensemble of structural unfolding intermediates, the free energies of the rate-limiting transition states of the bacteriorhodopsin mutants decreased as the distance of those transition states to the folded intermediate states decreased. Thus, all mutants exhibited Hammond behavior and a change in the free energies of the intermediates along the unfolding reaction coordinate and, consequently, their relative occupancies. This is the first experimental proof showing that point mutations can reshape the free energy landscape of a membrane protein and force single proteins to populate certain unfolding pathways over others.


Figures

Fig. 1
Fig. 1
Mapping the point mutations on the BR trimer. (a) Top view from the extracellular surface emphasizes that none of the mutations were at the monomeric interface within the BR trimer (PDB code 1BRR), which may affect the integrity of the BR assembly. (b) BR monomer showing the mutations P50A (red), M56A (blue), Y57A (green) in α-helix B (yellow), P91A (orange) in α-helix C (purple), and P186A (cyan) in α-helix F (red). Values in blue denote amino acid positions at which the major force peaks, i.e., peaks occurring with 100% frequency, were detected in the force-distance (F–D) curve. Values in brackets are amino acid positions from the C-terminal, i.e., the direction of pulling by SMFS.
Fig. 2
Fig. 2
Unfolding pathways of WT and mutant BR. (a) Superimposition of 43 F–D curves of mutant P50A collected at 600 nm/s (same as Fig. 3B). Force peaks with highest density fitted with the WLC model (dark blue curves) at amino acid positions 88, 148 and 219 form the main peaks in the unfolding pathways. F–D curves can show side peaks at a much lower probability (<20%) some of which are masked by the noise in the superimposition. WLC fits to these peaks are shown in light purple. A closer look at individual F–D curves in the superimposition (areas in colored boxes) reveals these side peaks. (b) Secondary structure of BR showing all the intermediates that occurred in different BR unfolding pathways detected by SMFS. Transmembrane α-helices outlined in colored boxes denote secondary structure elements that unfolded pairwise. The structural segments that formed the alternate unfolding pathways of α-helices are shown by the different color shades of the helices. (c) Shows individual peaks in F–D curves fitted by the WLC model denoting different unfolding pathways via which P50A could unfold. Values at the top of each WLC fit denote the amino acid positions in the secondary structure of BR shown in (b). The distance between two subsequent peaks denotes the length of the structural segment. The combination of different force peaks detected in an F–D curve constitutes the unfolding pathway of the protein. All possible pathways observed in WT BR were also detected for BR mutants. (d) Denotes the structural segments stabilized by the molecular interactions as detected by the force peaks in (c). Black arrows denote secondary structure elements that unfolded as a pair. These structures could also unfold via alternative pathways as shown by differently colored arrows. Unfolding intermediates for WT and all mutants BR remained the same. Color coding of boxes in (a) corresponds to that in (b) and (c). Color coding of the structural segments in (b) corresponds to that of force peaks in (c) and to that of the arrows denoting the unfolding of different structural segments in (d).
Fig. 3
Fig. 3
Superimpositions of F–D traces recorded upon unfolding WT and mutant BR using SMFS. The superimposition of F–D traces (a–f) enhances similarities among the unfolding patterns detected upon unfolding single BR. The superimpositions were fitted with the WLC model to show the occurrence of main peaks at the same positions in each case. No shift in the peak positions was noticed (Supplementary Fig. 2). The gray scales allowed to statistically interpret the gray values of the superimpositions. All F–D traces superimposed were collected at a speed of 600 nm/s. To show the peaks clearly, only 43 curves were superimposed in each case. The number of curves analyzed at this speed for each BR type was: 165 (WT BR), 102 (P50A), 114 (M56A), 80 (Y57A), 117 (P91A), 74 (P186A).
Fig. 4
Fig. 4
DFS of BR mutants. All five BR mutants were unfolded at six different speeds: 87.2, 300, 600, 1310, 2620 and 5230 nm/s. The slope of a semilogarithmic plot of the unfolding force versus loading rate gave the xu and ku values for each structural segment forming an intermediate in the unfolding pathway. As shown (a–f), the slopes of some structural segments in mutants P50A (red), M56A (blue) and Y57A (green) remained the same when compared to WT BR (black), whereas some structural segments showed an intersection denoting a crossover in their stabilities at a specific loading rate. α-Helix B could unfold through three different pathways denoted as loop BC and α-helix B, α-helix B-1, and α-helix B-2 (Fig. 2). (d) to (f) show the unfolding forces in each of these pathways for all the mutants. α-Helix B in P50A unfolded with higher forces (red points in d–f) at all the speeds. For clarity, the unfolding forces of P91A and P186A are not shown. xu and ku values for all the mutants are given in Table 1. Data points are average values of unfolding forces, and the error bars represent the SEM. The SEM values for all the mutants were similar to that shown for P50A.
Fig. 5
Fig. 5
Free energy diagram for the mechanical unfolding of α-helices B and C in WT and mutant BR. (a) The scheme was calculated from SMFS experiments described in the text. Free energies (ΔGu*) were calculated from the unfolding rate constants obtained from the DFS data. xu was determined as described in Materials and Methods. We have assumed that the total distance between the energy minima of the folded (left) and unfolded stretched states (right) represents the length of the fully stretched polypeptide chain of α-helices B and C, ~71 amino acids (0.36 nm×71= 25.56 nm). In addition, we have assumed that all the intermediate states have a common origin. As shown, the positions of the transition states for P50A, P91A, P186A, M56A and Y57Awere significantly shifted towards the folded state of α-helices B and C. All the mutations decreased the heights of the unfolding energy barriers. (b) Quantitative relation between the shift of energy barriers and the decrease in kinetic stabilities.
Fig. 6
Fig. 6
Hammond behavior of structural segments of WT and mutant BR. The plots of Δxu/(xu–WT) versus Δln(ku)/ln(ku–WT) show that in all the structural segments of the mutants xu increased with increasing activation energy. However, the trend followed by a structural segment of a mutant in one pathway was not the same in another pathway.
Fig. 7
Fig. 7
Changes induced in the mechanical unfolding energy landscape of BR due to point mutations. A schematic representation of the energy landscape showing the crinkled minima denoted by roughness scale ε. The energetically similar minima in the energy landscape give rise to an ensemble of native or intermediate structures. Small perturbations in the protein due to a single mutation may change the relative populations of these native structures or unfolding intermediates forcing the protein to unfold via different energetic pathways (red and green arrows).

References

    1. Daggett V, Fersht A. The present view of the mechanism of protein folding. Nat. Rev. Mol. Cell Biol. 2003;4:497–502. - PubMed
    1. Dill KA, Chan HS. From Levinthal to pathways to funnels. Nat. Struct. Biol. 1997;4:10–19. - PubMed
    1. Bowie JU. Solving the membrane protein folding problem. Nature. 2005;438:581–589. - PubMed
    1. White SH, Wimley WC. Membrane protein folding and stability: physical principles. Annu. Rev. Biophys. Biomol. Struct. 1999;28:319–365. - PubMed
    1. Daggett V, Fersht A. Is there a unifying mechanism for protein folding. Trends Biochem. Sci. 2003;28:19–26. - PubMed

Publication types

LinkOut - more resources