. 2008 Jan 11;132(1):113-24.
doi: 10.1016/j.cell.2007.11.042.

PTRF-Cavin, a conserved cytoplasmic protein required for caveola formation and function

Affiliations

PTRF-Cavin, a conserved cytoplasmic protein required for caveola formation and function

Michelle M Hill et al. Cell. .

Abstract

Caveolae are abundant cell-surface organelles involved in lipid regulation and endocytosis. We used comparative proteomics to identify PTRF (also called Cav-p60, Cavin) as a putative caveolar coat protein. PTRF-Cavin selectively associates with mature caveolae at the plasma membrane but not Golgi-localized caveolin. In prostate cancer PC3 cells, and during development of zebrafish notochord, lack of PTRF-Cavin expression correlates with lack of caveolae, and caveolin resides on flat plasma membrane. Expression of PTRF-Cavin in PC3 cells is sufficient to cause formation of caveolae. Knockdown of PTRF-Cavin reduces caveolae density, both in mammalian cells and in the zebrafish. Caveolin remains on the plasma membrane in PTRF-Cavin knockdown cells but exhibits increased lateral mobility and accelerated lysosomal degradation. We conclude that PTRF-Cavin is required for caveola formation and sequestration of mobile caveolin into immobile caveolae.


Figures
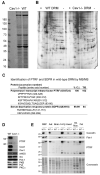
Figure 1
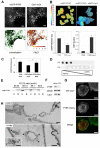
Figure 1. Identification of PTRF as a protein enriched in Cav1-containing DRM.
DRM prepared from WT and Cav1−/− MEF were analysed by (A) SDS-PAGE (5-15%) and colloidal Coomassie staining or (B) 2D gel electrophoresis (pH3-10, 12%) and silver staining. (C) Slices from a 12% colloidal Coomassie-stained SDS-PAGE gel were digested with trypsin and analysed by mass spectrometry. PTRF and SDPR were identified in WT but not Cav1−/− DRM. %C.I (% Confidence Interval) and TIS (Total Ion Score) from Mascot searches are shown. (D) The enrichment of PTRF in WT DRM was confirmed by western blotting and compared with selected signaling proteins. (E) Expression of PTRF, caveolin and flotilllin-1 was examined by western blotting in MEF and adult tissue lysates prepared from WT and Cav1−/− mice. Twenty μg of each lysate was loaded and the membrane was Coomassie stained to confirm protein loading. The blots are representative of two independent tissue lysates. SDS-PAGE molecular weight markers are shown in kDa. Adr, adrenal gland; Sk. Mus, skeletal muscle.
Figure 2
Figure 2. PTRF associates with caveolae
(A) WT MEF and (B) NIH 3T3 fibroblasts grown on coverslips were labelled for endogenous Cav1 and PTRF, then examined by confocal microscopy. In both cell types Cav1 and PTRF show extensive colocalization in cell surface puncta. Bars, 10 μm. (C) Immuno-EM of plasma membrane sheet shows co-labelling of Cav1-GFP (5 nm gold) with PTRF-RFP (2 nm gold; arrowheads) in co-transfected BHK cells. Bar, 100 nm. (D) Cav1−/− MEF labelled for endogenous PTRF, or (E) transfected with PTRF-Flag and labelled for the Flag tag show diffuse labeling of PTRF. Bars, 10 μm. Live cell images of GFP-PTRF in unfixed WT and KO MEF are available in Figure. S1.
Figure 3
Figure 3. Cav1 expression is sufficient to recruit PTRF to DRM; PTRF is recruited to the cell surface by caveolae-generating forms of Cav1 and Cav3 but is not recruited to caveolin at the Golgi complex
(A)DRMs prepared from WT MEF, Cav1−/− MEF, and Cav1−/− MEF in which Cav1 was re-expressed by infection with adenovirus-Cav1, was analyzed by western blotting for PTRF, Flotillin-1 and Cav1. (B-H) Cav1−/− MEF co-transfected with PTRF-Flag and Cav1-HA (B), Cav3-HA (C), Cav3 P104L-HA (D), Cav3 C71W-JA (E), C. elegans caveolin (Ce-Cav1-Cherry, panel F), Apis mellifera caveolin (Bee-Cav-HA; panel G) or zebrafish-Cav1-YFP (panel H) were fixed, labelled with anti-Flag antibody and anti-HA antibody where required. The localization of expressed PTRF and caveolin was examined by confocal microscopy. Note that C. elegans Cav1 (Ce-Cav1-Cherry) associates with the cell surface but does not generate caveolae (unpublished results) and does not recruit PTRF to the plasma membrane. Bars, 10 μm.
Figure 4
Figure 4. PTRF and caveolin interacts in a cholesterol-dependent manner. PTRF is required for caveolae formation in PC3 cells
(A) BHK cells were transiently transfected with mCFP-PTRF and mCit-Cav1. The distribution of mCFP-PTRF is observed in the donor channel and mCit-Cav1 in the acceptor channel image. FRET was observed in vesicular structures along the plasma membrane (arrowheads) and at the cell periphery (arrows). FRET was calculated per pixel as a sensitized acceptor emission index FR, ranging from 1 (no FRET) to 10. Overlay of a binary colocalization image (green pixels) and a binary FRET image showing all pixels with FR>2 in black, revealed that all structures where mCFP-PTRF and mCit-caveolin-1 colocalized also exhibited FRET. Bars, 2 μm. (B) BHK cells transiently expressing mGFP-PTRF with, or without mRFP-Cav3 were imaged in a wide-field FLIM microscope. Representative FLIM images are shown and the fluorescence lifetime (ns) of mGFP displayed as a heat map. In the presence of the acceptor mRFP the lifetime of the donor mGFP is significantly decreased; this was quantified by calculating the mean lifetime of mGFP on a cell by cell basis (mean ± SEM, n ≥ 50 cells from three independent experiments). The reduced mGFP lifetime reflects FRET between mGFP and mRFP as a result of the molecular proximity of PTRF and Cav3. The fraction of donor fluorophores undergoing FRET was extracted from the FLIM data (see Experimental Procedures). *p<0.0001. (C) FLIM experiment was performed as described for (B), except that cells were treated with 1% Methyl-β-cyclodextrin for 20 min (MCD) or left untreated (CON). *p<0.001. (D) PTRF binding to phosphatidylserine (PS) in a solid-phase assay. Each spot contained 2 μg of phospholipid with gradual decrease of the anionic phospholipid content as indicated. Binding of PTRF was detected by immunoblotting. PG, phosphatidylglycerol, DOPC, dioleoylphosphatidylcholine. (E) PTRF binding to acidic phospholipids was assayed by co-sedimentation with liposomes containing decreasing amounts of phosphatidylserine (PS, mass balanced by phosphatidylcholine, PC). U, unbound fraction, B, bound fraction. Binding of PTRF is essentially absent in liposomes lacking PS. (F) The protein levels of PTRF and Cav1 was examined by immunoblotting in 10 μg of total cell lysates from HeLa and PC3 cells. Tubulin was used as a loading control. (G) PC3 cells grown on glass coverslips were transfected with PTRF-cherry, and labelled for endogenous Cav1. The example image shows one transfected cell (left) and one untransfected cell (right) in the same field. (H) Control or PTRF-transfected PC3 cells were fixed in the presence of ruthenium red to label the cell surface, and examined by electron microscopy. Control cells show few uncoated invaginations with the morphology of caveolae; note the 120nm coated vesicle (arrowhead). In transfected cells, numerous uncoated pits (arrowheads) with the typical morphology of single caveolae and caveolae rosettes are evident. Caveolae density increased from 0.26±0.13 caveolae per field in control cells to 1.70±0.94 in PTRF transfected cells. Transfection efficiency was approximately 50%. Bars, 200nm.
Figure 5
Figure 5. PTRF knockdown reduces caveolae density in NIH 3T3 cells
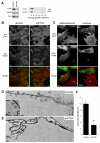
NIH 3T3 fibroblasts were transfected with shRNA to PTRF (shPTRF) or control shRNA (shCON). Stable cell lines were generated by selection in G418. (A) shPTRF cells show reduction of PTRF expression without affecting Cav1 association with DRMs on sucrose gradient. (B) Immunofluorescence labeling of methanol-fixed shCON and shPTRF cells shows punctuate Cav1 labeling in shCON cells and diffuse labeling in shPTRF cells. Note that PTRF antibody labeling is weak under these conditions which were optimized to show the differential Cav1 labeling in the two cell types. Bars, 1 μm. (C) shPTRF NIH 3T3 fibroblasts were transfected with PTRF-GFP and then labelled for Cav1. In transfected cells Cav1 shows the characteristic punctate staining seen in WT MEF, NIH 3T3 and shCON cells, whereas untransfected cells (asterisks) show diffuse labeling for Cav1. Bars, 1 μm. (D-F) To quantitate surface caveolae, shCON cells (D) or shPTRF cells (E) were surface-labeled by fixation in the presence of ruthenium red. Abundant caveolae, surface pits of approximately 65nm diameter, are evident close to the surface of shCON cells (arrowheads) but rarely in shPTRF cells. Caveolae density was quantitated (F) from three independent experiments as described in Experimental Procedures.*p<0.005 Bars, 200 nm.
Figure 6
Figure 6. PTRF knockdown causes redistribution of Cav1 to non-caveolar membrane, increases the Cav1 degradation and lateral mobility at the plasma membrane
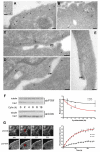
Localization of Cav1 was examined in shCON (A-B) and shPTRF (C-E) cells by quantitative immunoelectron microscopy on frozen sections. In control cells, 81.7±4.6% of surface caveolin was associated with 65nm vesicles close to, or clearly connected to the plasma membrane (arrowheads A,B). In contrast, 79.1±5.3% of surface caveolin labelling was associated with non-caveolar membrane in shPTRF cells. Bars, 200nm. pm, plasma membrane. (F) PTRF knockdown accelerates the degradation of Cav1. shPTRF and shCON cells were treated with 10 μM cycloheximide for the indicated times, and the level of Cav1 protein assessed by immunoblotting whole cell lysates. Tubulin was used as a loading control. Graph represents data from two independent experiments. (G) PTRF knockdown results in a highly significant increase (p<0.001) in the mobile fraction of Cav1. Control and shPTRF fibroblasts were transiently transfected with YFP-Cav1. A 36 μm2 area of the cell (boxed in the second image) was bleached to background levels and images were then captured at 14 second intervals. The mean of normalised data from 10 independent FRAP experiments per cell type are plotted and the τd and Rf derived from a one-phase exponential association fit to the data. The half life (τd) for shCON was not significantly different from shPTRF (74 sec and 60 sec, respectively).
Figure 7
Figure 7. PTRF is required for caveolae formation in zebrafish notochord cells
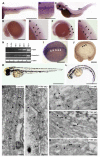
(A-G) Expression pattern of PTRF during zebrafish development was analysed by wholemount mRNA in situ hybridisation. Anterior is to the left and dorsal to the top. PTRF expression was detected in the notochord (n) in 24h embryos (A) and 31h embryos (B). In 72h embryos (C), expression was detected in dorsal blood vessels (dbv), in the otic vesicle (ov) and in the branchial arches (ba). PTRF mRNA expression was first detected in 18h embryos (F, G) and it was not detected in 16h embryos (D, E). (H) RT-PCR comparing the temporal mRNA expression pattern of PTRF and Cav1 during early embryo development. PTRF mRNA expression arose at 18h and was maintained throughout the development until 72h. Cav1 mRNA expression was detected earlier than PTRF, and was detected in the notochord as early as 12h by in situ hybridisation (I). Expression of Cav1 protein was observed in the notochord by immunohistochemistry of 16h embryos (J).Arrowheads in A-J indicate the notochord. (K, L) PTRF knockdown embryos were generated by morpholino (MO) injection (6 ng/embryo). At 48h, 79% of control MO injected embryos appeared normal (K), whereas 44% of embryos injected with PTRF MO were curved under and/or presented heart edema (L). (M-Q) Ultrastructural analysis and immunogold labeling of the notochord of 48h embryos injected with control MO (M, O) or PTRF MO (N,P,Q). In the regions of cell-cell contact, the plasma membranes (PM) of neighbouring cells are closely apposed. The plasma membrane in these regions is covered in caveolae (some of which are indicated by arrowheads) in the control MO-injected embryos (M). Caveolin immunogold labeling (arrowheads) is associated with the invaginated caveolae as seen in frozen sections labeled in parallel (O). The density of caveolae is greatly reduced in PTRF MO-injected embryos (N) and the plasma membranes of neighbouring cells are less closely apposed. Caveolin labeling is associated predominantly with flat plasma membrane rather than invaginated caveolae in the PTRF MO-injected embryos (P,Q). pm, plasma membrane. Scale bars (A, B, C, D, F, I, J, K, L) 250 μm, (E, G) 80 μm and (M-Q) 200 nm.

Comment in

  • PTRF triggers a cave in.
    Chadda R, Mayor S. Chadda R, et al. Cell. 2008 Jan 11;132(1):23-4. doi: 10.1016/j.cell.2007.12.021. Cell. 2008. PMID: 18191216 Review.

References

    1. Aboulaich N, Vainonen JP, Stralfors P, Vener AV. Vectorial proteomics reveal targeting, phosphorylation and specific fragmentation of polymerase I and transcript release factor (PTRF) at the surface of caveolae in human adipocytes. Biochem J. 2004;383:237–248. - PMC - PubMed
    1. Burgener R, Wolf M, Ganz T, Baggiolini M. Purification and characterization of a major phosphatidylserine-binding phosphoprotein from human platelets. Biochem J. 1990;269:729–734. - PMC - PubMed
    1. Clayton AH, Hanley QS, Verveer PJ. Graphical representation and multicomponent analysis of single-frequency fluorescence lifetime imaging microscopy data. J Microsc. 2004;213:1–5. - PubMed
    1. Dawson JC, Legg JA, Machesky LM. Bar domain proteins: a role in tubulation, scission and actin assembly in clathrin-mediated endocytosis. Trends Cell Biol. 2006;16:493–498. - PubMed
    1. Drab M, Verkade P, Elger M, Kasper M, Lohn M, Lauterbach B, Menne J, Lindschau C, Mende F, Luft FC, et al. Loss of caveolae, vascular dysfunction, and pulmonary defects in caveolin-1 gene-disrupted mice. Science. 2001;293:2449–2452. - PubMed

Publication types

MeSH terms

Associated data