. 2008 Jan 11;132(1):137-48.
doi: 10.1016/j.cell.2007.11.024.

Docking of axonal mitochondria by syntaphilin controls their mobility and affects short-term facilitation

Affiliations

Docking of axonal mitochondria by syntaphilin controls their mobility and affects short-term facilitation

Jian-Sheng Kang et al. Cell. .

Abstract

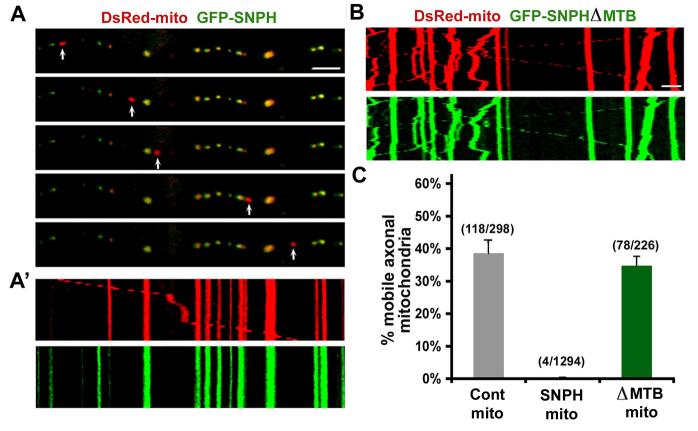
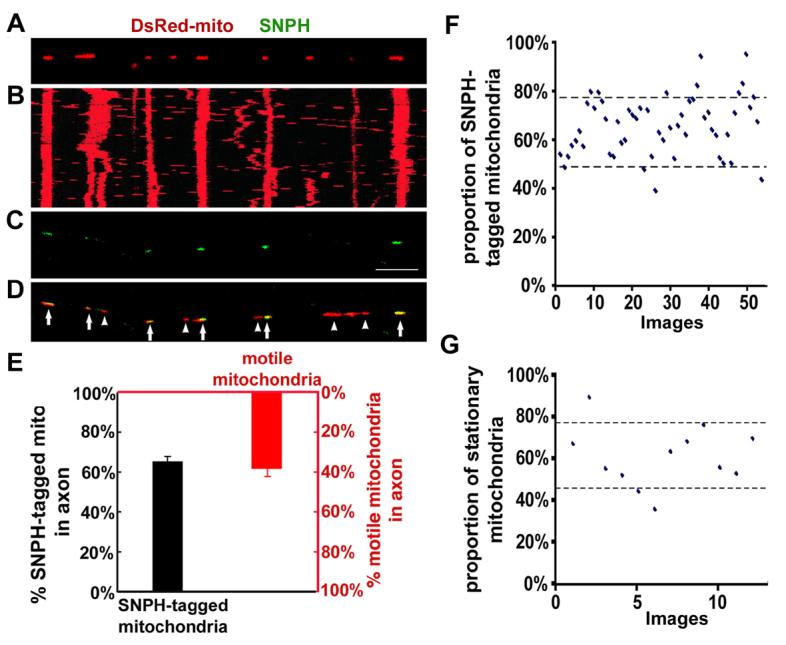
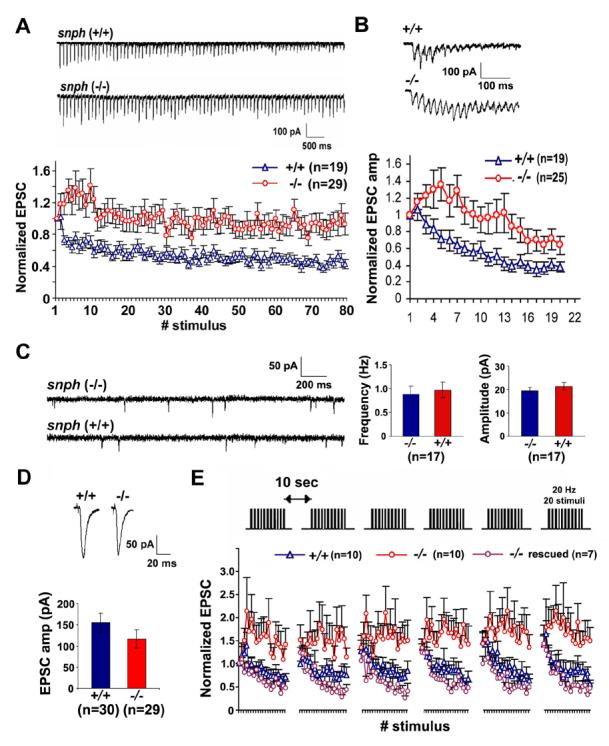
Proper distribution of mitochondria within axons and at synapses is critical for neuronal function. While one-third of axonal mitochondria are mobile, a large proportion remains in a stationary phase. However, the mechanisms controlling mitochondrial docking within axons remain elusive. Here, we report a role for axon-targeted syntaphilin (SNPH) in mitochondrial docking through its interaction with microtubules. Axonal mitochondria that contain exogenously or endogenously expressed SNPH lose mobility. Deletion of the mouse snph gene results in a substantially higher proportion of axonal mitochondria in the mobile state and reduces the density of mitochondria in axons. The snph mutant neurons exhibit enhanced short-term facilitation during prolonged stimulation, probably by affecting calcium signaling at presynaptic boutons. This phenotype is fully rescued by reintroducing the snph gene into the mutant neurons. These findings demonstrate a molecular mechanism for controlling mitochondrial docking in axons that has a physiological impact on synaptic function.


Figures

Figure 1
Figure 1. Axonal Mitochondrial Targeting of SNPH in Cultured Hippocampal Neurons
(A) Hippocampal neurons at DIV14 were co-immunostained with antibodies against SNPH and the dendritic marker MAP2 or the axonal marker tau. (B) Neurons were co-immunostained for SNPH and mitochondrial marker cytochrome c. Arrows point to SNPH-associated mitochondria and arrowheads indicate SNPH-negative mitochondria within an axonal process. Scale bars, 10 μm. (C) Schematic diagrams of GFP-tagged SNPH truncated or deleted mutants and their capability for targeting to mitochondria and axons of hippocampal neurons.
Figure 2
Figure 2. SNPH Immobilizes Axonal Mitochondria
Neurons were co-transfected at DIV6 with DsRed-mito and GFP-SNPH (A) or GFP-SNPH-ΔMTB mutant lacking the microtubule-binding (MTB) domain (B). Axonal mitochondrial motility was observed in live neurons one week after transfection. (A) While GFP-SNPH-negative mitochondrion (red, pointed by arrows) migrates along the axonal process, GFP-SNPH-labeled mitochondria (yellow) remain stationary during the time-lapse observation (16 min). (A'), Motion data in (A) is presented in kymograph, in which vertical lines represent stationary mitochondria and slant line or curve indicate motile one. (B) Kymograph showing the motility of axonal mitochondria labeled with GFP-SNPH-ΔMTB. Scale bars in all panels, 10 μm. (C) Relative motility of the axonal mitochondria labeled with DsRed-mito alone as controls (n=298 from 16 axons) or co-labeled with DsRed-mito and GFP-SNPH (n=1294 from 39 axons) or DsRed-mito and GFP-SNPH-ΔMTB (n=226 from 9 axons). Error bars: s.e.m.
Figure 3
Figure 3. Motility Analysis of Axonal Mitochondria Containing Endogenous SNPH
(A) Hippocampal neurons were transfected with DsRed-mito, and time-lapse imaged to monitor mitochondrial movement within axons. (B) The kymograph for the time-lapse images of (A). (C, D) The image taken in the same region of the axon as (A) after fixation and staining with an anti-SNPH antibody immediately following time-lapse imaging. Scale bar: 10 μm. Arrows point to the mitochondria tagged with SNPH (yellow) and arrowheads indicate the SNPH-negative mitochondria (red). Note the correlation between the endogenous SNPH-tagged mitochondria in (C) and stationary mitochondria (vertical line) in (B). (E) A complementary relationship between the mean percentages of the SNPH-tagged mitochondria (black, 1126/1727, 54 images) and the motile mitochondria (red, 120/305, 12 time-lapse images). (F, G) Scatter plots with 90% confidence intervals show the percentages of the SNPH-tagged mitochondria (62±14%, 54 images)(F) and the stationary mitochondria within axons (62±15%, 12 time-lapse images)(G).
Figure 4
Figure 4. The Microtubule-binding Domain of SNPH Is Sufficient to Immobilize Axonal Mitochondria
(A) SNPH associates with microtubules. COS cells were transfected with either GFPSNPH (1-469), a truncated SNPH in which the C-terminal mitochondrial targeting domain was deleted, or GFP-SNPH (1-469)ΔMTB, followed by staining for β-tubulin one day after transfection. In the middle pane, the transfected cells were treated with 10 μM of Nocadazol for 1 hr to disassemble microtubules. (B) The microtubule-binding domain is required for SNPH to be co-pelleted with microtubules in a spin down assay. GST-SNPH (1-469) or GST-SNPH (1-469)ΔMTB was incubated in the absence or presence of Taxol-stabilized microtubules. The supernatant (S) and pellets (P) were analyzed by SDS-PAGE and visualized by Coomassie blue staining. (C, D) Schematic diagrams and mobility of axonal mitochondria labeled with GFP-TOM22 or GFP-MTB-TOM22, a chimeric transgene in which the MTB was placed between GFP and the mitochondrial outer-membrane protein TOM22. Kymographs: 10 min. Scale bars: 10μm.
Figure 5
Figure 5. Increased Mobility and Reduced Density of Axonal Mitochondria in the Neurons of the snph (−/−) Mice
(A, B) Four representative kymographs recorded from the snph (+/+) (A) and (−/−) (B) neurons. Hippocampal neurons were transfected with DsRed-mito at DIV6, followed by time-lapse imaging six days post-transfection. Density of stationary axonal mitochondria is visualized during the entire recording time (16 min). Scale bars: 10 μm. (C, D) Quantitative analysis of the percentage of motile axonal mitochondria (C) and relative density of axonal mitochondria (D) (**p<0.01, U test).
Figure 6
Figure 6. Deletion of the snph Gene Results in Synaptic Short-term Facilitation
(A, B) Sample traces recorded from the snph (+/+) and (−/−) neurons evoked by 10 Hz, 8 sec (A, upper panel) and 50 Hz, 60 msec (B, upper panel) and their normalized EPSC amplitudes plotted against stimulus number (lower panels of A and B). Substantial short-term facilitation was observed in the snph (−/−) neurons (red circles). (C) Deletion of the snph gene has no significant effect on the miniature AMPA currents. Left panel: representative miniature AMPA currents recorded from the snph (−/−) and (+/+) hippocampal neurons (DIV14). Right panel: bar graphs of averaged mini AMPA current frequency and amplitude. (D) Representative EPSCs (upper panels) recorded from paired neurons of the snph (+/+) and (−/−) mice at 0.05 Hz and the bar graph of mean EPSC amplitude (lower panel). No statistical difference was found between the snph (+/+) and (−/−) neurons (P=0.22, t test). (E) Deletion of the snph gene produces sustained short-term facilitation. 20 Hz, 1 sec stimulus train was delivered repetitively six times at 10-second intervals (upper panel). Normalized EPSC amplitudes were plotted against stimulus number (lower panel). Note that persistent facilitation in synaptic responses was shown only in the snph (−/−) neurons (red circles). Reintroducing the snph gene into the mutant presynaptic neuron (purple circles) eliminates the short-term facilitation and fully rescues the (+/+) phenotype (blue triangles).
Figure 7
Figure 7. Presynaptic Calcium Dynamics in the snph (+/+) and snph (−/−) Neurons
(A) Representative calcium images at presynaptic boutons of the snph (+/+) and (−/−) neurons before stimulation (1), at the beginning (2) and the end (3), and after stimulation (4). Calcium transients within presynaptic boutons labeled with DsRed-monomersynaptophysin were imaged using Fluo-4NW at 50 ms intervals upon stimulation at 10 Hz for 10 seconds. The images are pseudocolored, with blue representing low [Ca2+] concentration and red representing high [Ca2+] concentration. Scale bars: 1 μm. (B) The time course of changes in presynaptic fluorescent intensity over baseline (ΔF/F0) from the snph (+/+) (black, n=32) and (−/−) (red, n=33) neurons. Inset: the peak values of intracellular [Ca2+] levels within boutons were averaged from last 10 stimuli (20 frames of calcium imaging), expressed as % increase of fluorescence intensity over baseline (ΔF/F0), and are significantly different (p<0.001, t test) between the snph (+/+) (24%±2%) and (−/−) (33%±2%) neurons. Error bars: s.e.m.

References

    1. Aiello GL, Bach-y-Rita P. The cost of an action potential. J. Neurosci. Methods. 2000;103:145–149. - PubMed
    1. Belles B, Hescheler J, Trube G. Changes of membrane currents in cardiac cells induced by long whole-cell recordings and tolbutamide. Pflugers Arch. 1987;409:582–588. - PubMed
    1. Benshalom G, Reese TS. Ultrastructural observations on the cytoarchitecture of axons processed by rapid-freezing and freeze-substitution. J. Neurocytol. 1985;14:943–960. - PubMed
    1. Berthold CH, Fabricius C, Rydmark M, Andersén B. Axoplasmic organelles at nodes of Ranvier. I. Occurrence and distribution in large myelinated spinal root axons of the adult cat. J. Neurocytol. 1993;22:925–940. - PubMed
    1. Billups B, Forsythe ID. Presynaptic mitochondrial calcium sequestration influences transmission at mammalian central synapses. J. Neurosci. 2002;22:5840–5847. - PMC - PubMed

Publication types

MeSH terms