. 2008 Mar 13;46(4):737-47.
doi: 10.1016/j.jpba.2007.11.035. Epub 2007 Nov 29.

Development of tissue-targeted metabonomics. Part 1. Analytical considerations

Affiliations

Development of tissue-targeted metabonomics. Part 1. Analytical considerations

Kristin E Price et al. J Pharm Biomed Anal. .

Abstract

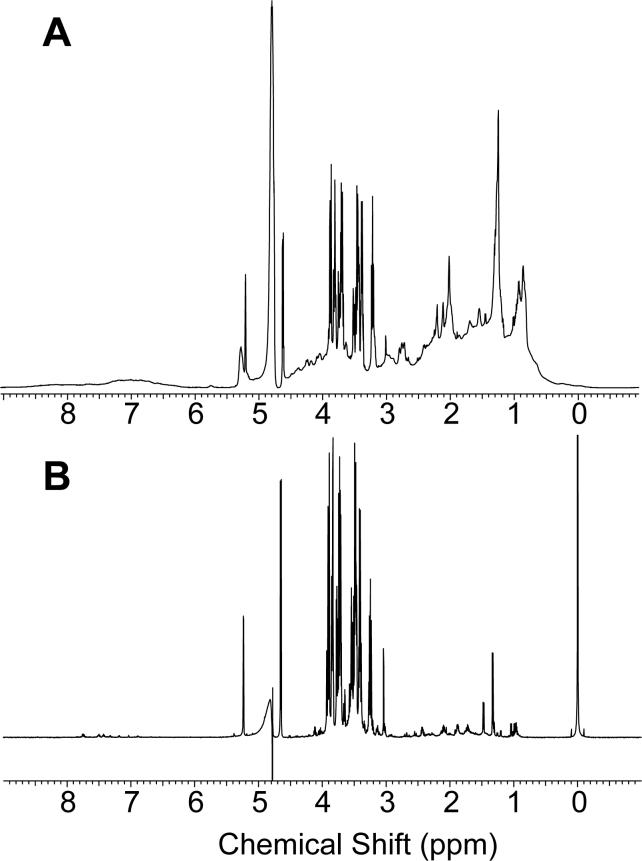
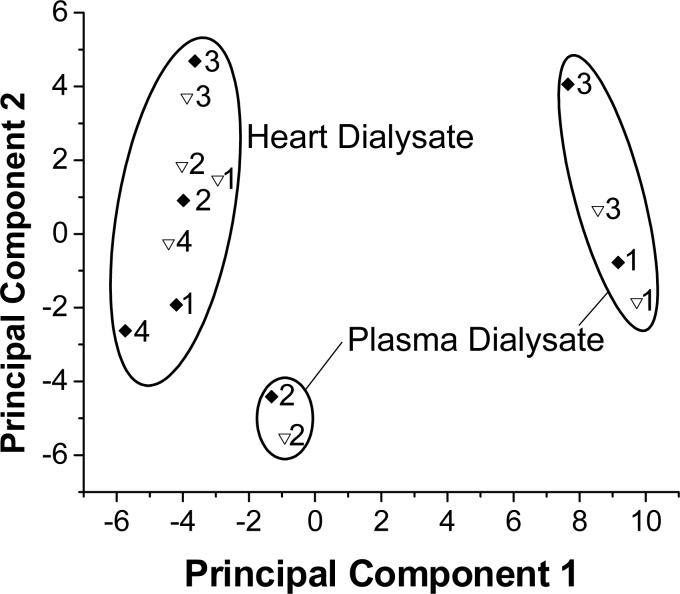
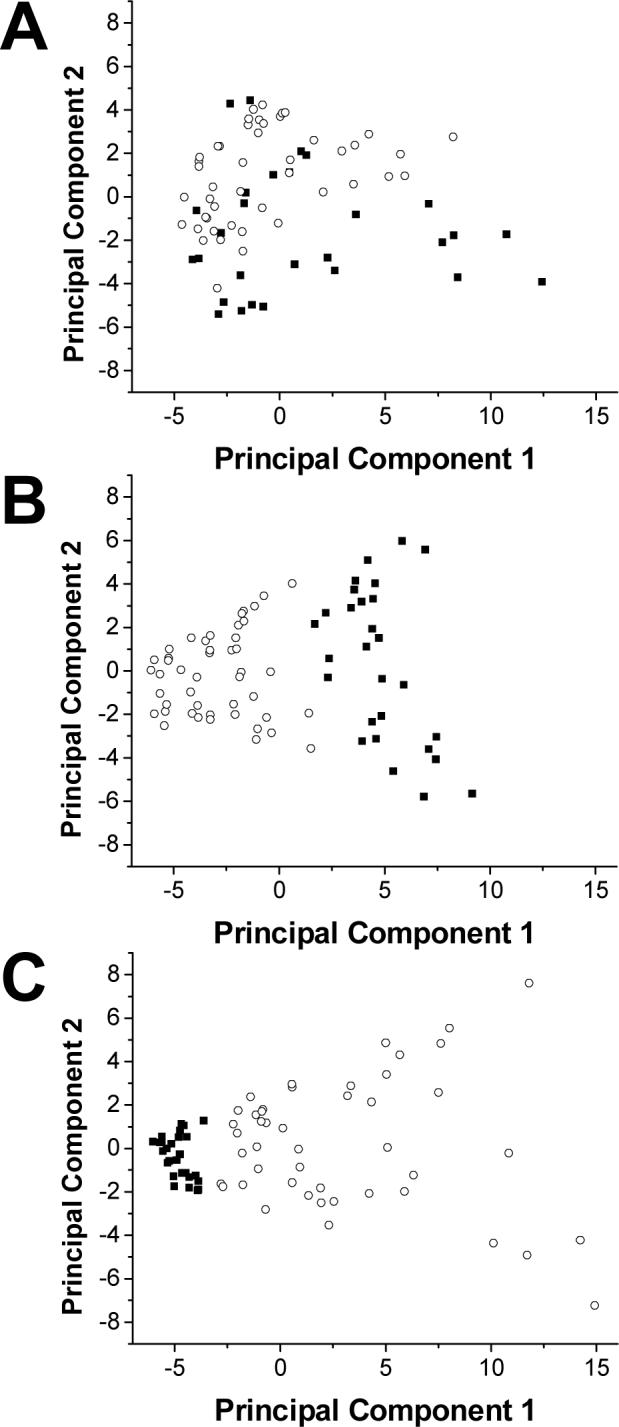
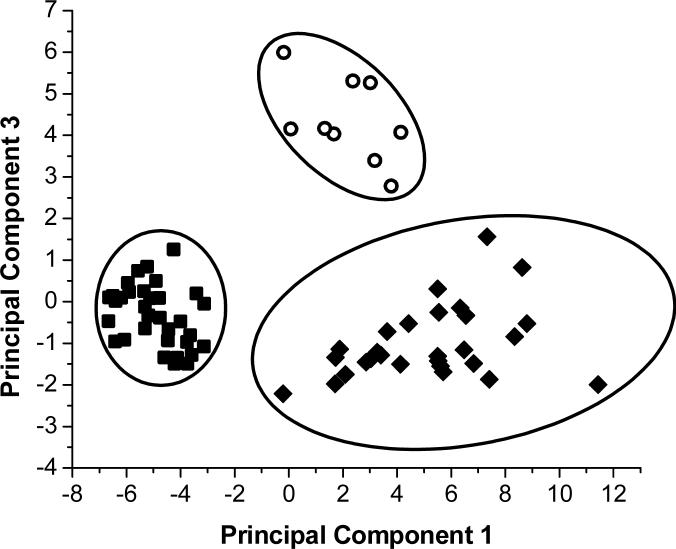
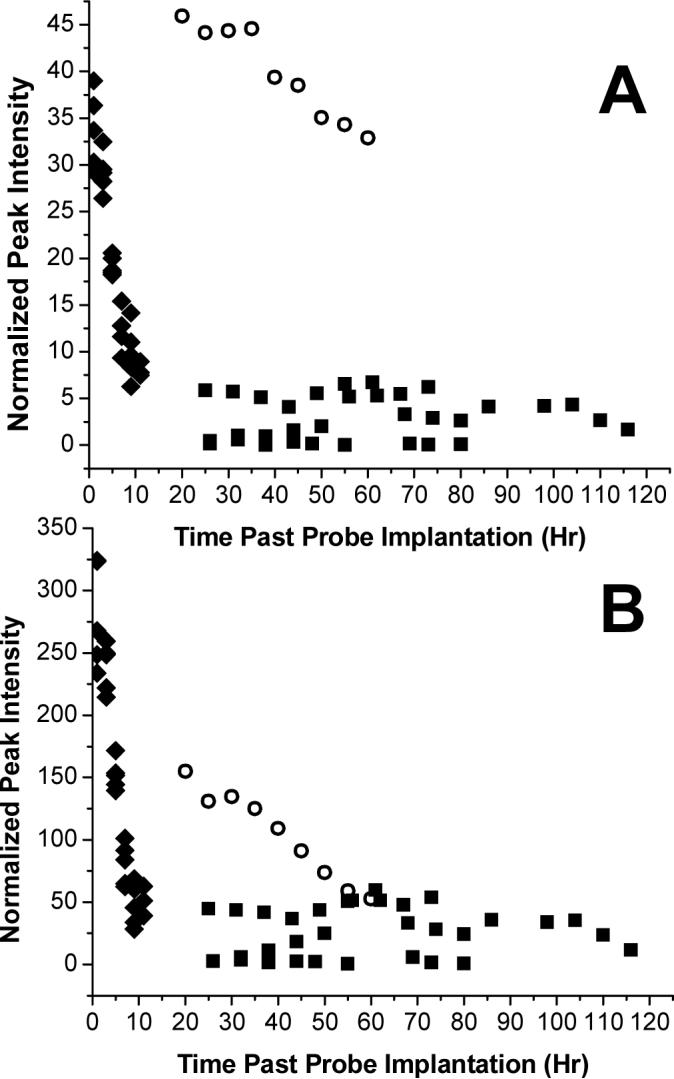
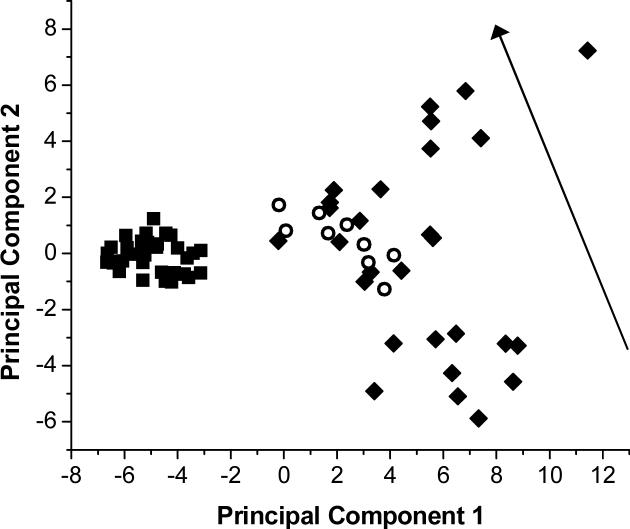
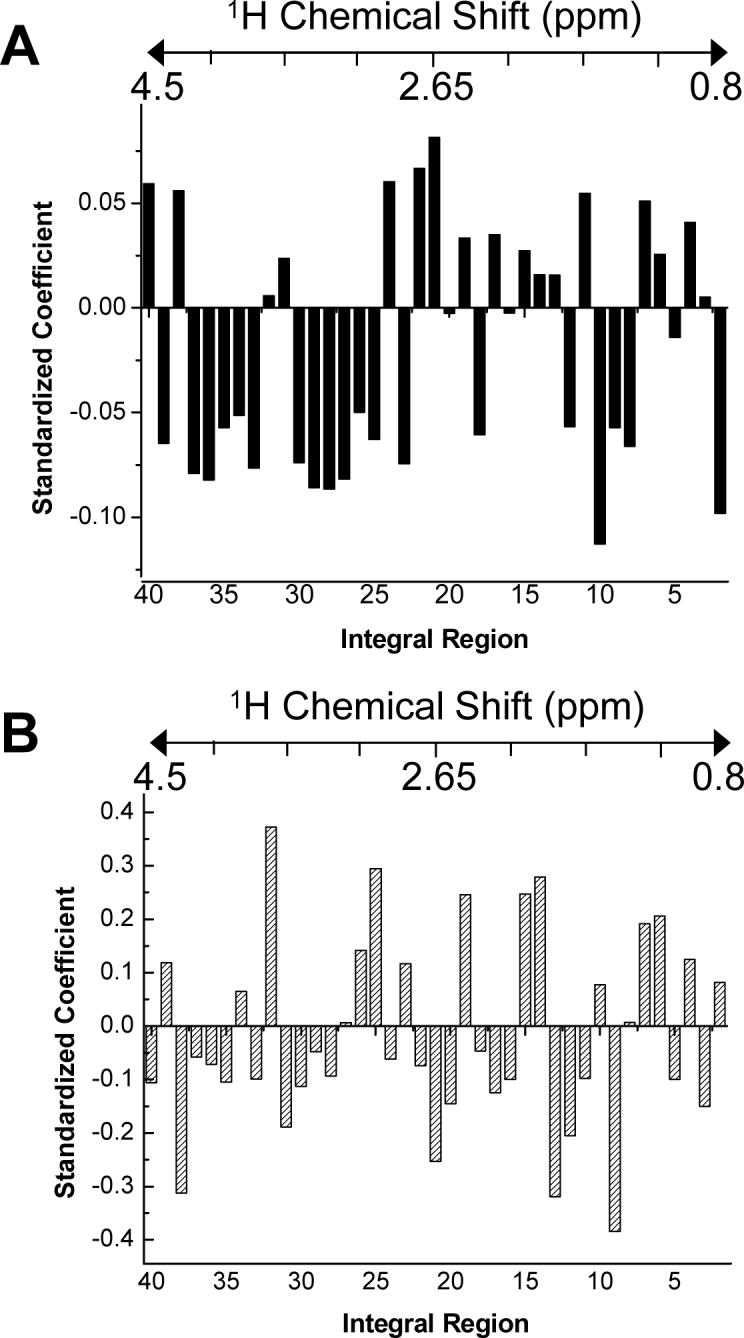
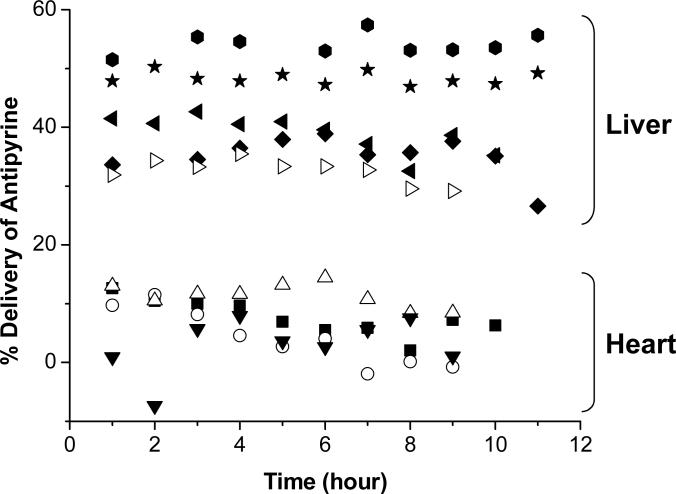
Tissue-targeted metabonomics provides tissue specific metabolic information while still retaining the profiling approach of traditional metabonomics. Microdialysis sampling is used to generate site-specific samples of endogenous metabolites. The dialysate samples are subjected to proton NMR analysis with data analysis by principal components analysis and partial least squares regression. In this study, sample and data pretreatment methods were examined for their impact on the quality of the data analysis. Specifically, the effects of speed vacuuming, sample solubility, sample pH stability, and sample storage stability were examined. Data pretreatment methods examined included the effects of standardization and normalization to internal standards. In addition, the ability of tissue-targeted metabonomics to generate time trend data was explored and more fully characterized using principal components analysis and partial least squares regression.


Figures

Figure 1
Figure 1
Comparison of the 1H-NMR spectra of (A) plasma and (B) plasma dialysate.
Figure 2
Figure 2
Score plot comparing sample preparation methods for dialysate samples. ◆ represents samples speedvacuumed to dryness and reconstituted in deuterated solution immediately prior to NMR analysis. ▽ represents samples frozen prior to NMR analysis and then diluted to 10% D2O. Each point is labeled with its individual sample number.
Figure 3
Figure 3
Effects of normalization on principal components analysis. A shows a score plot of basal heart and liver dialysate using unnormalized integrals. B shows a score plot of the same data normalized to TSP, the internal standard. C shows a score plot of the same data normalized to both TSP and the % delivery of the microdialysis probe. ■ represents basal liver dialysate samples. ○ represents basal heart dialysate samples.
Figure 4
Figure 4
Comparison of liver metabolic states by principal components analysis. ○ represents samples of basal liver dialysate from an awake rat with sepsis. ■ represents samples of basal liver dialysate taken from healthy awake rats. ◆ represents samples of basal liver dialysate taken from anesthetized healthy rats.
Figure 5
Figure 5
Comparison of liver glucose levels over time. ○ represents samples of basal liver dialysate from an awake rat with sepsis. ■ represents samples of basal liver dialysate taken from healthy awake rats (n=3). ◆ represents samples of basal liver dialysate taken from anesthetized healthy rats (n=4). A shows changes in the 3.51−3.52 ppm region and B shows changes in the 3.36−3.46 ppm region.
Figure 6
Figure 6
Time trends observed in basal liver dialysate using principal components analysis. ○ represents samples of basal liver dialysate from an awake rat with sepsis. ■ represents samples of basal liver dialysate taken from healthy awake rats. ◆ represents samples of basal liver dialysate taken from anesthetized healthy rats. The arrow shows the direction of the time trend observed in the anesthetized rats.
Figure 7
Figure 7
Standardized coefficients for PLS regression analysis. A shows the coefficients from PLS analysis of basal liver dialysate from anesthetized rats. Model statistics showed an R2 of 0.916 and an R2 predicted of 0.874. B shows the coefficients from PLS analysis of basal liver dialysate from awake rats. Model statistics showed an R2 of 0.488 and an R2 predicted of 0.152. The approximate correspondence of the integral regions to chemical shift is shown by the chemical shift scale above each graph.
Figure 8
Figure 8
Comparison of microdialysis probe performance for heart and liver tissues as gauged by in vivo delivery of 7 μM antipyrine. Liver probes (n=5) showed an average % delivery of 41.8% ± 2.3%. Heart probes (n=4) showed an average % delivery of 6.58% ± 3.64%.

References

    1. Lindon JC, Holmes E, Nicholson JK. Pharm. Res. 2006;23:1075–1088. - PubMed
    1. Nicholson JK, Lindon JC, Holmes E. Xenobiotica. 1999;29:1181–1189. - PubMed
    1. Trygg JA,J, Gullberg J, Johansson AI, Jonsson P, Antti H, Marklund SL, Moritz T. Anal. Chem. 2005;77:8086–8094. - PubMed
    1. Fancy S-A, Beckonert O, Darbon G, Yabsley W, Walley R, Baker D, Perkins GL, Pullen FS, Rumpel K. Rapid Commun. Mass Spectrom. 2006;20:2271–2280. - PubMed
    1. O'Hagan S, Dunn WB, Brown M, Knowles JD, Kell DB. Anal. Chem. 2005;77:290–303. - PubMed

Publication types