. 2008 Jan;28(1):64-74.
doi: 10.1016/j.immuni.2007.11.020.

A scaffold protein, AHNAK1, is required for calcium signaling during T cell activation

Affiliations

A scaffold protein, AHNAK1, is required for calcium signaling during T cell activation

Didi Matza et al. Immunity. 2008 Jan.

Abstract

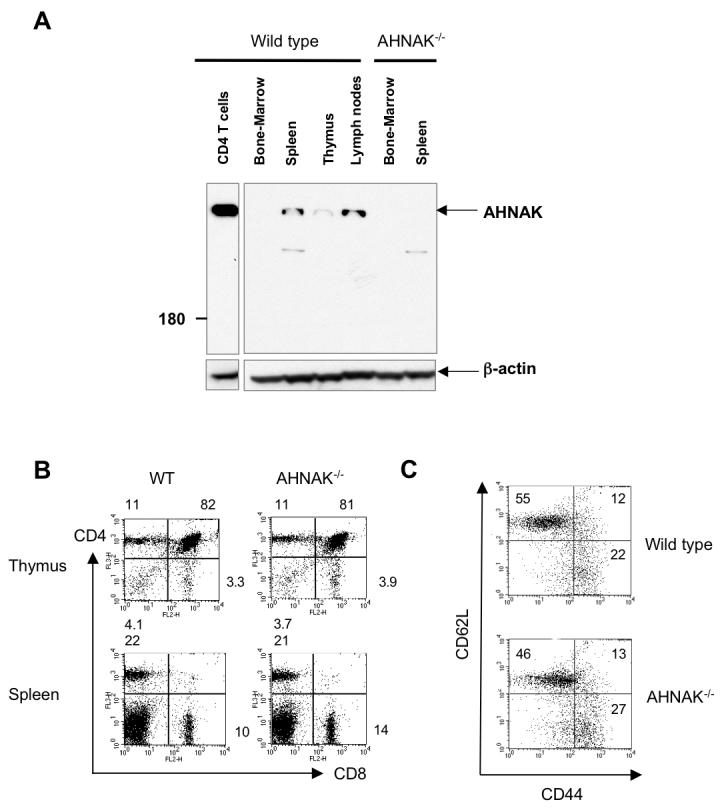
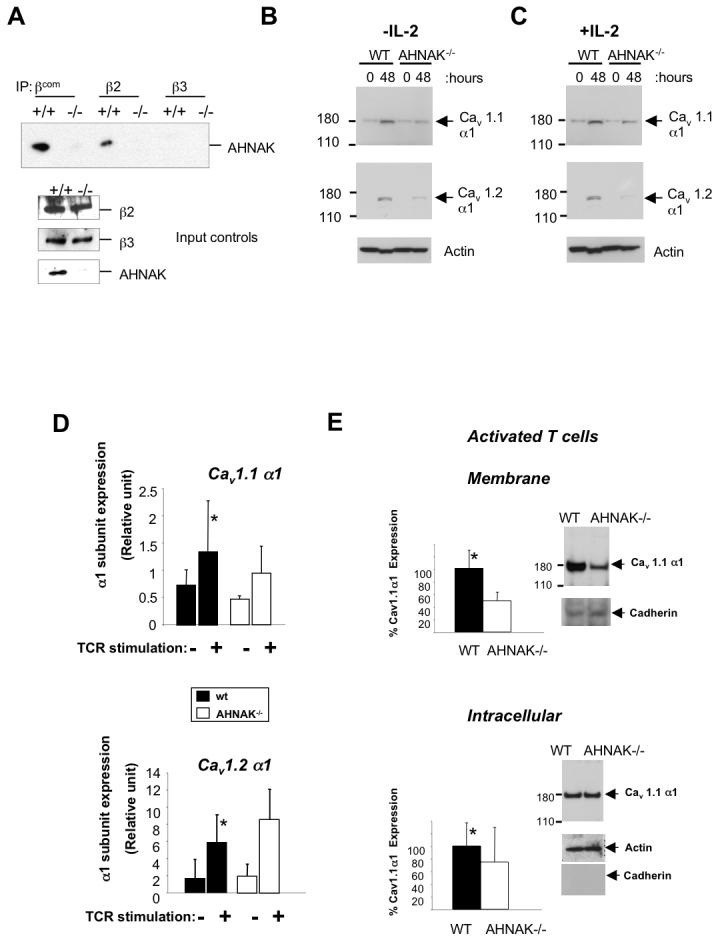
Engagement of the T cell antigen receptor (TCR) during antigen presentation initiates a coordinated action of a large number of signaling proteins and ion channels. AHNAK1 is a scaffold protein, highly expressed by CD4+ T cells, and is a critical component for calcium signaling. We showed that AHNAK1-deficient mice were highly susceptible to Leishmania major infection. AHNAK1-deficient CD4+ T cells responded poorly to TCR stimulation in vitro with low proliferation and low Interleukin-2 production. Furthermore, AHNAK1 deficiency resulted in a reduced calcium influx upon TCR crosslinking and subsequent poor activation of the transcription factor NFAT. AHNAK1 was required for plasma membrane expression of L-type calcium channels alpha 1S (Cav1.1), probably through its interaction with the beta regulatory subunit. Thus, AHNAK1 plays an essential role in T cell Ca2+ signaling through Cav1 channels, triggered via TCR activation; therefore, AHNAK1 is a potential target for therapeutic intervention.


Figures

Figure 1
Figure 1
Expression of AHNAK1 in T cells. (A) Bone marrow, spleen, thymus and lymph nodes were isolated from wild-type and AHNAK1−/− mice. The expression of AHNAK1 in tissues and CD4 T cells was examined by western blot analysis using anti-AHNAK1-C2 antibody. β-actin was used for loading control. Results are representative of at least three independent experiments. (B) Normal CD4/CD8 composition of AHNAK1−/− T cells in thymus and spleen. Thymocytes/splenocytes from wild-type and AHNAK1−/− mice were prepared, stained with anti-CD4 and anti-CD8 antibodies and analyzed by flow cytometry. Results are representative of at least three independent experiments. (C) Normal memory/naïve population of AHNAK1−/− T cells. Splenocytes from both wild-type and AHNAK1−/− mice were analyzed by flow cytometry using anti-CD44 and CD62L antibody as in C. Results are representative of at least three independent experiments.
Figure 2
Figure 2
AHNAK1 is required for protection against Leishmania major infection. Wild-type and AHNAK1 mice were challenged in the right hind foot with 106 L. major stationary phase promastigotes. (A) Lesion development (as a ratio of infected foot to non-infected foot) results with time postinfection. Results are representative of at least three independent experiments. (B) At 2 weeks postinfection, four mice per group were sacrificed and parasite burden was determined by limiting dilution assay. Results shown are representative of two independent experiments. (C) wild-type IFNγ and IL-4 levels were measured by ELISA in 96 hrs culture supernatant of purified popliteal lymph node CD4 T cells from infected mice cultured with irradiated wild-type APCs and indicated doses of L.major antigen. Results shown are representative of two independent experiments with 3 infected mice in each group. (D) Macrophages and CD4 T cells were isolated from wild-type mice. The expression of AHNAK1 in these cells was compared by western blot analysis using anti-AHNAK1-C2 antibody. AHNAK1−/− CD4 T cell extract and β-actin were used as controls for the specificity of the AHNAK1 antibody and loading, respectively. (E) Peritoneal macrophages from wild-type and AHNAK1−/− mice were infected with L. major in vitro and cultured for 72 hours in the either presence or absence of LPS (200 ng/ml) and IFNγ (300 ng/ml). Internalized parasites were detected by staining with DAPI and counted. Results are representative of at least three independent experiments.
Figure 3
Figure 3
AHNAK1 is required for the proliferation of T cells. (A) Decreased proliferation of AHNAK1−/− CD4 T cells. CD4 T cells from wild-type and AHNAK1−/− mice were purified and stimulated in vitro using plate bound anti-CD3 (10 μg/ml), or soluble anti-CD3 (10 μg/ml) and irradiated wild-type splenocytes for indicated periods. [3H] thymidine was added to the culture during the last 8 hours of each time point followed by measurement of the incorporation. Results are representative of at least three independent experiments. (B) Production of IL-2 from wild-type and AHNAK1−/− CD4 T cells was assessed by ELISA after stimulation with plate bound anti-CD3 antibody (10 μg/ml) for indicated periods. Results are representative of at least three independent experiments. (C) Proliferation of wild-type and AHNAK1−/− CD4 T cells was assessed by CFSE assay after stimulation with plate bound anti-CD3 antibody (2 μg/ml) with or without addition of exogenous IL-2 into the culture. Results are representative of two independent experiments. (D) [3H] thymidine incorporation assay was performed as A with or without addition of exogenous IL-2. Results are representative of at least three independent experiments..
Figure 4
Figure 4
AHNAK1 is required for calcium signalling and NFAT activation upon TCR stimulation. (A) CD4 T cells from wild-type and AHNAK1−/− mice were purified and stimulated in vitro using plate bound anti-CD3 (10 μg/ml), anti-CD28 (2 μg/ml) and exogenous IL-2 for 48 hrs. Cells were then washed and incubated with anti-CD3 (10 μg/ml) for 30 min on ice and were subsequently cross-linked by goat anti-hamster Ig antibody (GAH). Calcium concentration was measured by ratiometric method using Fura-2 as a probe. Results are representative of at least three independent experiments. (B) CD4 T cells were stimulated with anti-CD3 (10 μg/ml) and anti-CD28 (2 μg/ml) antibodies for the indicated periods. Nuclear localization of NFATc1 and NFATc2 was examined by western blot analysis using cytoplasmic or nuclear extracts. β-actin was used as internal control. Results are representative of two independent experiments, each with 10 wild-type or AHNAK1−/− mice. (C) DNA binding of NFAT-c2 was examined using nuclear extracts from wild-type and AHNAK−/− purified CD4 T cells. (D) [3H] thymidine incorporation assay was performed after stimulation of CD4 cells with plate bound anti-CD3 antibody (2 μg/ml) with or without addition of ionomycin (0.5 μM) into the culture. Results are representative of at least three independent experiments
Figure 5
Figure 5
AHNAK1 is required for membrane expression of Cav1 channels. (A) Association of AHNAK1 with the β subunits of Cav1 channels. Lysates were prepared from splenocytes of wild-type and AHNAK1−/− mice and immunoprecipitated with antibodies against β subunit 2, 3 or all βsubunits (βcom). The membrane was blotted with anti-AHNAK1-C2 antibody. Results are representative of two independent experiments. (B) CD4 T cells were stimulated with anti-CD3 (10 μg/ml) and anti-CD28 (2 μg/ml) antibodies and total cell lysates were prepared. The expression of Cav1 channels was examined by western blotting with anti-Cav1.1 and Cav1.2 antibodies. The same membrane was blotted with anti-β-actin antibody for loading control. Results are representative of at least three independent experiments. (C) This experiment was performed as in B with the only difference that IL-2 was added to the culture media. Results are representative of at least three independent experiments. (D) CD4 T Cells were stimulated as in C and Cav1.1 and 1.2 α1 subunits expression was examined by real time PCR. Results are representative of at least three independent experiments. p-value represent the difference in expression between wild-type and AHNAK1−/−(p=0.235 and p=0.366 for Cav1.1 and Cav1.2, respectively). (E) Cells were stimulated as in C followed by fractionation of membrane proteins and western blot analysis as described in B. Densitometry represents statistical analysis of three independent experiments (p=0.02 and p=0.25 for membrane and intracellular expression of Cav1.1 respectively). Cav1.1 membrane protein expression was normalized to pan-cadherin and intracellular expression was normalized to β-actin. A representative western blot used for densitometry is shown.

Comment in

References

    1. Badou A, Jha MK, Matza D, Mehal WZ, Freichel M, Flockerzi V, Flavell RA. Critical role for the beta regulatory subunits of Cav channels in T lymphocyte function. Proc Natl Acad Sci U S A. 2006;103:15529–15534. - PMC - PubMed
    1. Badou A, Matza D, Klemic KG, Govindaragulu U, Kaczmarek LK, Flavell RA. Requirement for Cav1.1 during TCR mediated calcium influx in T cells. 2007 manuscript submitted; enclosed for reviewers.
    1. Badou A, Savignac M, Moreau M, Leclerc C, Foucras G, Cassar G, Paulet P, Lagrange D, Druet P, Guery JC, Pelletier L. Weak TCR stimulation induces a calcium signal that triggers IL-4 synthesis, stronger TCR stimulation induces MAP kinases that control IFN-gamma production. Eur J Immunol. 2001;31:2487–2496. - PubMed
    1. Badou A, Savignac M, Moreau M, Leclerc C, Pasquier R, Druet P, Pelletier L. HgCl2-induced interleukin-4 gene expression in T cells involves a protein kinase C-dependent calcium influx through L-type calcium channels. J Biol Chem. 1997;272:32411–32418. - PubMed
    1. Benaud C, Gentil BJ, Assard N, Court M, Garin J, Delphin C, Baudier J. AHNAK interaction with the annexin 2/S100A10 complex regulates cell membrane cytoarchitecture. J Cell Biol. 2004;164:133–144. - PMC - PubMed

Publication types

MeSH terms