. 2008 Apr 15;94(8):3047-64.
doi: 10.1529/biophysj.107.119990. Epub 2008 Jan 11.

Condensing and fluidizing effects of ganglioside GM1 on phospholipid films

Affiliations

Condensing and fluidizing effects of ganglioside GM1 on phospholipid films

Shelli L Frey et al. Biophys J. .

Abstract

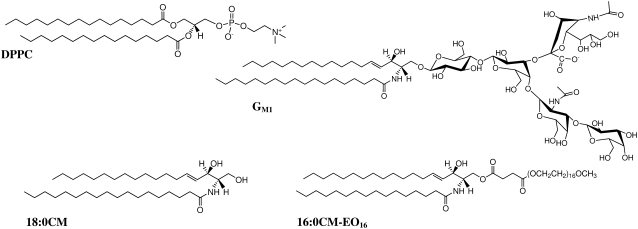
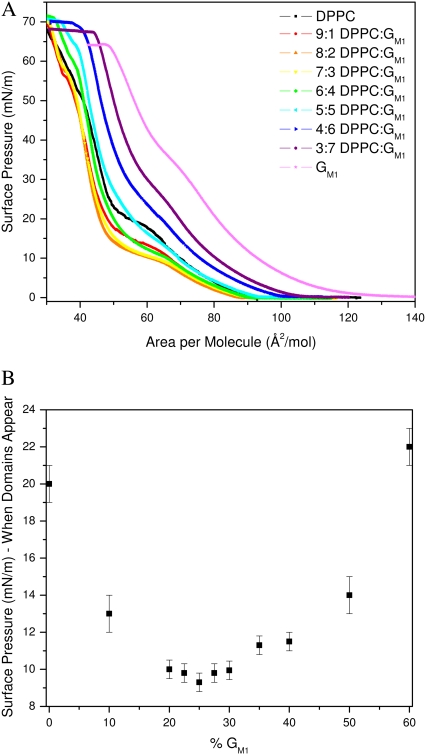
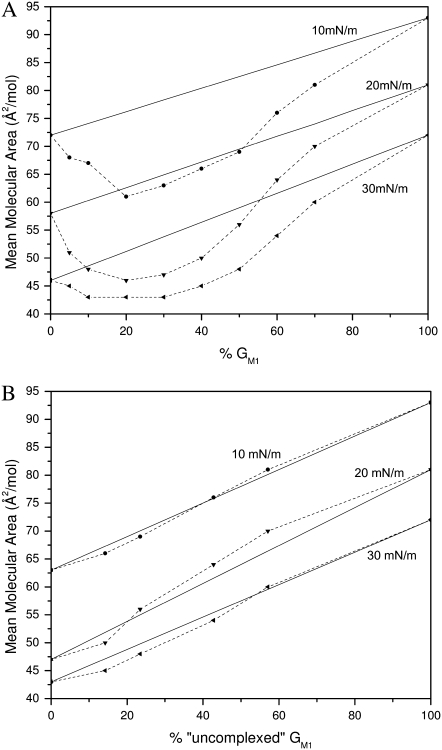
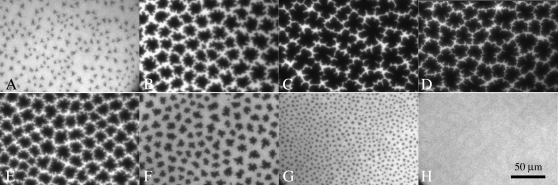
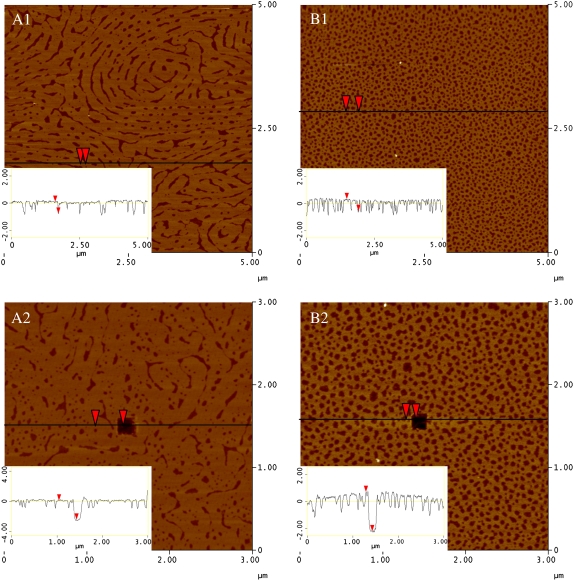
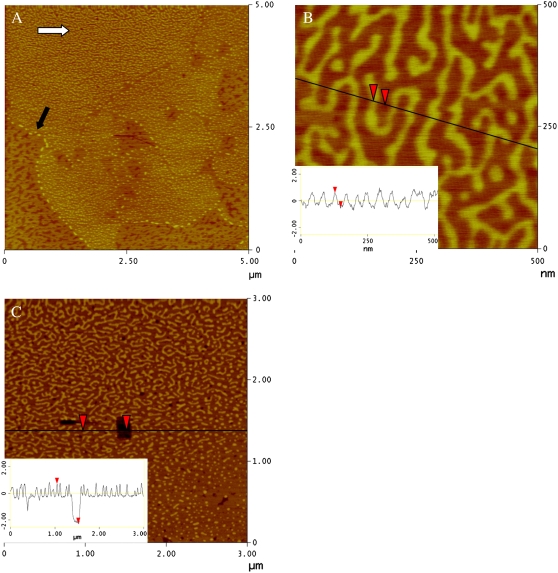
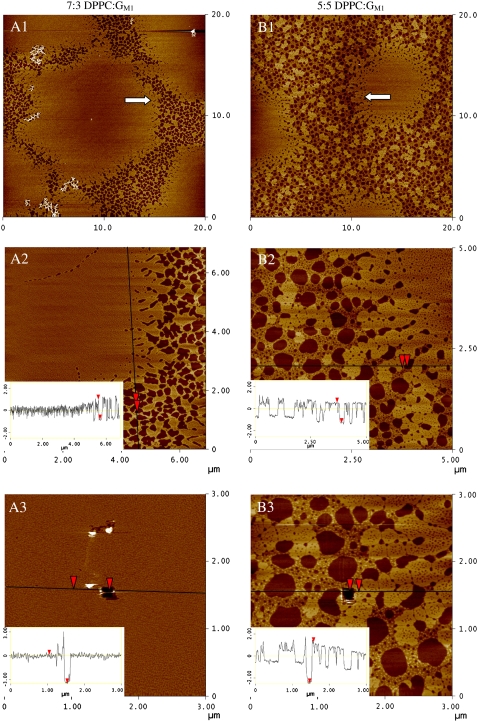
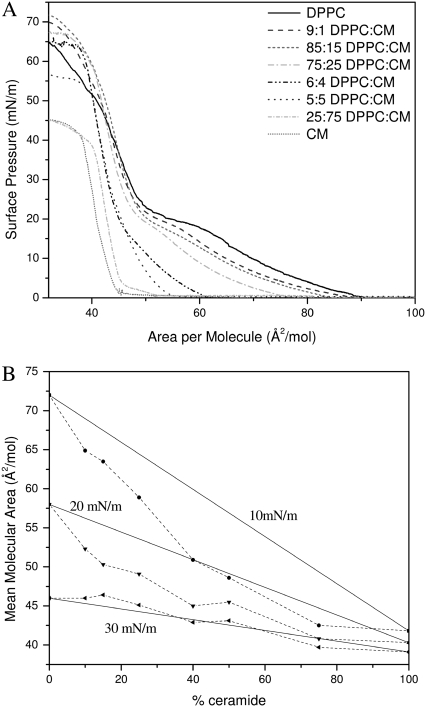
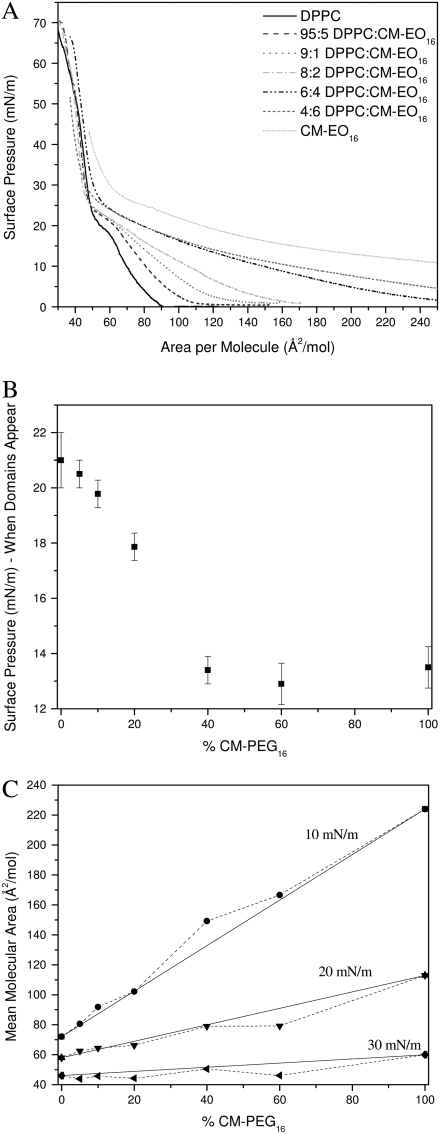
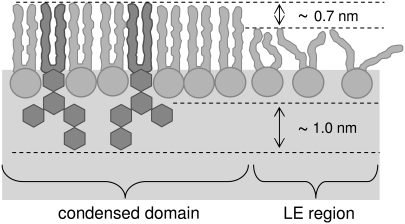
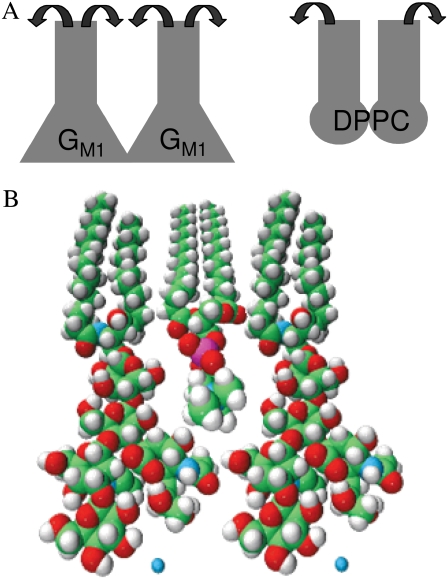
Mixed monolayers of the ganglioside G(M1) and the lipid dipalmitoylphosphatidlycholine (DPPC) at air-water and solid-air interfaces were investigated using various biophysical techniques to ascertain the location and phase behavior of the ganglioside molecules in a mixed membrane. The effects induced by G(M1) on the mean molecular area of the binary mixtures and the phase behavior of DPPC were followed for G(M1) concentrations ranging from 5 to 70 mol %. Surface pressure isotherms and fluorescence microscopy imaging of domain formation indicate that at low concentrations of G(M1) (<25 mol %), the monolayer becomes continually more condensed than DPPC upon further addition of ganglioside. At higher G(M1) concentrations (>25 mol %), the mixed monolayer becomes more expanded or fluid-like. After deposition onto a solid substrate, atomic force microscopy imaging of these lipid monolayers showed that G(M1) and DPPC pack cooperatively in the condensed phase domain to form geometrically packed complexes that are more ordered than either individual component as evidenced by a more extended total height of the complex arising from a well-packed hydrocarbon tail region. Grazing incidence x-ray diffraction on the DPPC/G(M1) binary mixture provides evidence that ordering can emerge when two otherwise fluid components are mixed together. The addition of G(M1) to DPPC gives rise to a unit cell that differs from that of a pure DPPC monolayer. To determine the region of the G(M1) molecule that interacts with the DPPC molecule and causes condensation and subsequent expansion of the monolayer, surface pressure isotherms were obtained with molecules modeling the backbone or headgroup portions of the G(M1) molecule. The observed concentration-dependent condensing and fluidizing effects are specific to the rigid, sugar headgroup portion of the G(M1) molecule.


Figures

FIGURE 1
FIGURE 1
Structure of the zwitterionic lipid DPPC, the ganglioside GM1, the ceramide 18:0CM, and the modified ceramide 16:0CM-EO16.
FIGURE 2
FIGURE 2
(A) Monolayer compression isotherms of pure DPPC, pure GM1, and binary mixtures of 9:1, 8:2, 7:3, 6:4, 5:5, 4:6, and 3:7 mol ratio DPPC/GM1 at 30°C (B) Surface pressure at which condensed (C) domains appear in monolayers composed of DPPC and GM1, plotted as a function of GM1 concentration. Domains were visualized using fluorescence microscopy with the TR-DHPE probe partitioning into the more fluid phase.
FIGURE 3
FIGURE 3
Mean area per molecule in mixed monolayers of DPPC and GM1 at surface pressures of 10, 20, and 30 mN/m. The solid lines represent values calculated by the additivity rule and correspond to ideal mixtures. Dashed lines are added to guide the eye. (A) Mean area per molecule plotted as a function of the percentage of GM1 in the monolayer. (B) Mean area per molecule assuming that 7:3 DPPC/GM1 and GM1 are the “pure” components plotted as a function of “uncomplexed” GM1. See text for details.
FIGURE 4
FIGURE 4
Fluorescence images of mixed DPPC/GM1 monolayers at a surface pressure of 20 mN/m. (A) 100:0. (B) 9:1. (C) 8:2. (D) 75:25. (E) 7:3. (F) 6:4. (G) 5:5. (H) 4:6.
FIGURE 5
FIGURE 5
AFM topographic images of (A1 and A2) DPPC and (B1 and B2) GM1 monolayers transferred at 30 mN/m (z-scale 5 nm). Section analysis insets show height differences among the sections (note: lighter in color corresponds to greater height). The dark hole in image (A2) DPPC and (B2) GM1 is a scratched area where the local material was removed by rapidly scanning (20 Hz) a 150 × 150 nm2 square at high force with the AFM tip. Resulting section analysis insets indicate the total height of the monolayer.
FIGURE 6
FIGURE 6
AFM topographic images of 9:1 DPPC/GM1 monolayers transferred at 30 mN/m (z-scale 5 nm). (A) Morphology at edge of a condensed domain. Fence of material (∼1 nm taller than surroundings) indicated by black arrow. (B) Image recorded by zooming into the condensed domain region marked with a white arrow in image A. Section analysis inset shows relative height difference between stripes of material. (C) Region near edge of condensed domain. The dark hole is a scratched area where the local material was removed by rapidly scanning (20 Hz) a 150 nm square at high force with the AFM tip. Resulting section analysis inset indicates the total height of the monolayer components.
FIGURE 7
FIGURE 7
AFM topographic images of (A) 7:3 and (B) 5:5 DPPC/GM1 monolayers transferred at 30 mN/m (z-scale 5 nm). (1) Global morphology. (2) Image recorded by zooming into the region at the edge of a condensed domain marked with an arrow in image 1. Section analysis insets show relative height differences among membrane components. (3) Region in middle (A) or edge (B) of condensed domain. The dark hole is a scratched area where the local material was removed by rapidly scanning (20 Hz) a 150 nm square at high force with the AFM tip. Resulting section analysis insets indicate the total height of the monolayer components.
FIGURE 8
FIGURE 8
Background subtracted GIXD data on a water subphase at 30°C for DPPC, GM1, and various binary mixtures displaying Bragg peaks. (A) 100:0 (squares), 95:5 (sideways triangles), 75:25 (triangles), 6:4 (inverted triangles), and 0:100 DPPC/GM1 (diamonds) at 15 mN/m. For clarity, the data have been offset vertically. Note the two pure components have no Bragg peaks, indicating a lack of in-plane order in the tail region. (B) Comparison of DPPC (open triangles) and 75:25 DPPC/GM1 (squares) at 23 (lower panel) and 30 mN/m (upper panel) to show the difference in type and degree of ordering. For clarity, the data at the two pressures have been offset vertically.
FIGURE 9
FIGURE 9
(A) Monolayer compression isotherms of pure DPPC, pure CM, and binary mixtures of 9:1, 85:15, 75:25, 6:4, 5:5, and 25:75 mol ratio DPPC/CM at 30°C (B) Mean area per molecule in mixed monolayers of DPPC and CM at surface pressures of 10, 20, and 30 mN/m plotted as a function of the percentage of CM in the monolayer. The solid lines represent values calculated by the additivity rule and correspond to ideal mixtures. Dashed lines are added to guide the eye.
FIGURE 10
FIGURE 10
(A) Monolayer compression isotherms of pure DPPC, pure CM-EO16, and binary mixtures of 95:5, 9:1, 8:2, 6:4, and 4:6 mol ratio DPPC/CM-EO16 at 30°C. CM-EO16 was deposited at a surface pressure of 5 mN/m. (B) Surface pressure at which condensed (C) domains appear in monolayers composed of DPPC and CM-EO16, plotted as a function of CM-EO16 concentration. (C) Mean area per molecule in mixed monolayers of DPPC and CM-EO16 at surface pressures of 10, 20, and 30 mN/m plotted as a function of the percentage of CM-EO16 in the monolayer. The solid lines represent values calculated by the additivity rule and correspond to ideal mixtures. Dashed lines are added to guide the eye.
FIGURE 11
FIGURE 11
Model of DPPC and GM1 monolayer at the air-water interface at low GM1 concentrations. Regions with DPPC/GM1 geometric complexes have a thickness of 3.7 nm. The headgroup of GM1 is ∼1.0 nm longer than that of DPPC. The height difference between an ordered and a disordered DPPC domain is ∼0.7 nm.
FIGURE 12
FIGURE 12
(A) Representation in terms of geometric shape of each pure component in a monolayer at low surface pressure (∼15 mN/m). When the headgroups of each molecule sterically interact, the monolayer remains disordered, or fluid, due to the smaller cross-sectional area of the tail region that allows conformational freedom of the hydrocarbon chains (indicated by the two arrows about the tail region). (B) Space-filling model of DPPC and GM1 in a close-packed or condensed arrangement. Note how the two different molecules, each fluid when in a pure monolayer as shown in A, can geometrically pack to reduce mobility in the tail region, causing condensed domains to form.

References

    1. Cheresh, D. A., J. R. Harper, G. Schulz, and R. A. Reisfeld. 1984. Localization of the gangsliosides GD2 and GD3 in adhesion plaques and on the surface or human-melanoma cells. Proc. Natl. Acad. Sci. USA. 81:5767–5771. - PMC - PubMed
    1. Burns, G. F., C. M. Lucas, G. W. Krissansen, J. A. Werkmeister, D. B. Scanlon, R. J. Simpson, and M. A. Vadas. 1988. Synergism between membrane gangliosides and ARG-GLY-ASP-directed glycoprotein receptors in attachment to matrix proteins by melanoma cells. J. Cell Biol. 107:1225–1230. - PMC - PubMed
    1. Hakomori, S. 1993. Structure and function of sphingoglycolipids in transmembrane signaling and cell-cell interactions. Biochem. Soc. Trans. 21:583–595. - PubMed
    1. Yates, A. J., J. D. Agudelo, and C.-C. Sung. 1992. Glycolipids of a human glioma cell-line bearing receptors for platelet-derived growth-factor (PDGF). Lipids. 27:308–310. - PubMed
    1. Derry, D. M., and L. S. Wolfe. 1967. Gangliosides in isolated neurons and glial cells. Science. 158:1450–1452. - PubMed

Publication types

LinkOut - more resources