. 2008 Apr;38(4):380-5.
doi: 10.1165/rcmb.2007-0224RC. Epub 2008 Jan 10.

The prolonged life-span of alveolar macrophages

Affiliations

The prolonged life-span of alveolar macrophages

Jaime Murphy et al. Am J Respir Cell Mol Biol. 2008 Apr.

Abstract

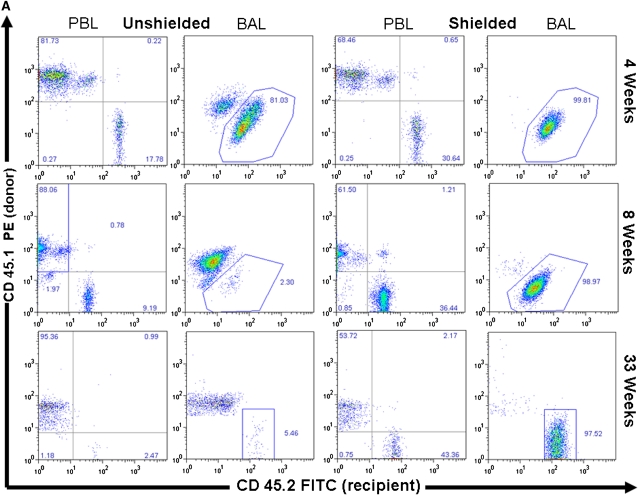
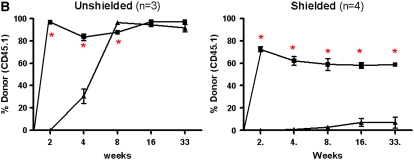
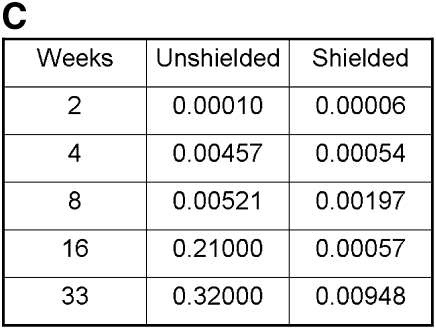
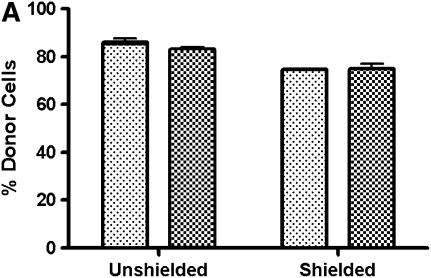
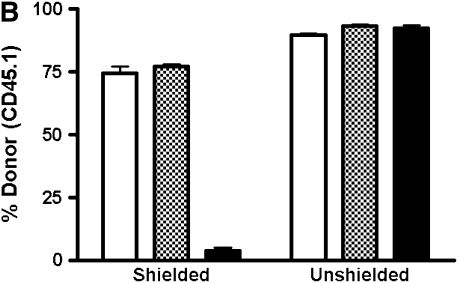
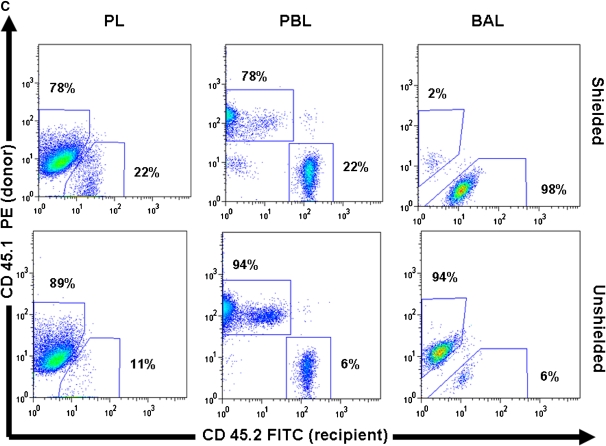
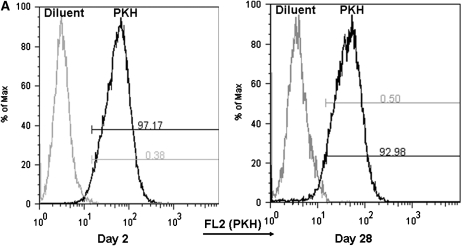
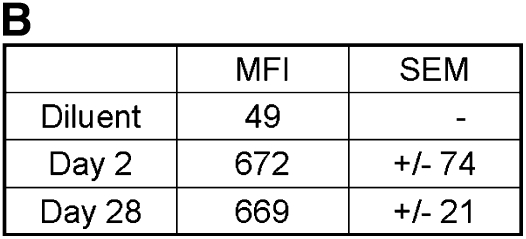
To further examine the half-life of alveolar macrophages, chimeric CD 45.2 mice were generated through bone marrow transplantation of donor CD 45.1 cells. Before administration of donor cells, recipient mice were divided into two cohorts: the first cohort received total body irradiation; the second cohort also received irradiation-however, the thorax, head, and upper extremities were shielded with lead. Flow cytometric analysis was then performed on blood, peritoneal, and bronchoalveolar lavage cells over time to quantify engraftment. The data generated for the unshielded cohort of mice revealed a macrophage half-life of 30 days. In the shielded cohort, however, we found that by 8 months there was negligible replacement of recipient alveolar macrophages by donor cells, despite reconstitution of the blood and peritoneum by donor bone marrow. Consistent with these findings, the mean fluorescent intensity of alveolar macrophages remained stable over a 4-week period after in vivo PKH26 dye loading. Together, these data show that previous alveolar macrophage half-life studies were confounded by the fact that they did not account for the toxic effects of irradiation conditioning regimens, and demonstrate that the bone marrow does not significantly contribute to the alveolar macrophage compartment during steady-state conditions.


Figures

<b>Figure 1.</b>
Figure 1.
Chimerism of peripheral blood leukocytes (PBL) and bronchoalveolar lavage (BAL) cells over time. (A) Representative flow cytometric analyses of donor (PE, y-axis) versus recipient (FITC, x-axis) chimerism in the PBL and BAL of shielded and unshielded animals at 4, 8, and 33 weeks after transplant. Boxed areas in BAL plots represent alveolar macrophages (AMs) of recipient phenotype. (B) Percent donor cells (CD45.1) in PBL (squares) and BAL (triangles) of unshielded and shielded mice 2 to 33 weeks after transplant. A paired two-tailed t test was used to compare PBL and BAL chimerism at each time point. *Statistically significant difference (P < 0.05). Number of animals for each time point is indicated except for Week 33, where n = 3 for shielded and n = 2 for unshielded animals. (C) Summary of P values for each time point.
<b>Figure 2.</b>
Figure 2.
Chimerism in peripheral blood mononuclear cells (PBMCs), CD11b+, and peritoneal lavage cells. (A) Graph showing percentage of PBMCs of donor origin that express the monocyte marker CD11b in shielded and unshielded mice 6 weeks after transplant (n = 3 for each group). Lightly shaded bars, % CD45; darkly shaded bars, % CD11b. (B) Graph showing percent of cells expressing a donor phenotype in peritoneal lavage (PL; open bars), PBL (shaded bars), and BAL (solid bars) of shielded and unshielded animals 10 weeks after transplant (n = 3 for each group). (C) Representative flow cytometric analysis of donor (PE, y-axis) versus recipient (FITC, x-axis) phenotypes from PL, PBL, and BAL of a shielded and unshielded animal.
<b>Figure 3.</b>
Figure 3.
Mean fluorescent intensity (MFI) in AMs at 2 days and 1 month after PKH26 labeling. (A) Representative histograms of fluorescence in the FL-2 channel in AMs recovered from BAL at 2 days and 1 month. (B) Table of MFI at 2 days and 1 month (mean ± SEM; n = 3).
<b>Figure 3.</b>
Figure 3.
Mean fluorescent intensity (MFI) in AMs at 2 days and 1 month after PKH26 labeling. (A) Representative histograms of fluorescence in the FL-2 channel in AMs recovered from BAL at 2 days and 1 month. (B) Table of MFI at 2 days and 1 month (mean ± SEM; n = 3).

References

    1. Virolainen M. Hematopoietic origin of macrophages as studied by chromosome markers in mice. J Exp Med 1968;127:943–952. - PMC - PubMed
    1. Nakata K, Rom WN, Honda Y, Condos R, Kanegasaki S, Cao Y, Weiden M. Mycobacterium tuberculosis enhances human immunodeficiency virus-1 replication in the lung. Am J Respir Crit Care Med 1997;155:996–1003. - PubMed
    1. Hoshino Y, Hoshino S, Gold JA, Raju B, Prabhakar S, Pine R, Rom WN, Nakata K, Weiden M. Mechanisms of polymorphonuclear neutrophil-mediated induction of HIV-1 replication in macrophages during pulmonary tuberculosis. J Infect Dis 2007;195:1303–1310. - PubMed
    1. Sanduzzi A, Fraziano M, Mariani F. Monocytes/macrophages in HIV infection and tuberculosis. J Biol Regul Homeost Agents 2001;15:294–298. - PubMed
    1. Orenstein JM, Fox C, Wahl SM. Macrophages as a source of HIV during opportunistic infections. Science 1997;276:1857–1861. - PubMed

Publication types