

Adiponectin, change in adiponectin, and progression to diabetes in the Diabetes Prevention Program
- PMID: 18192541
- PMCID: PMC2529455
- DOI: 10.2337/db07-1419
Adiponectin, change in adiponectin, and progression to diabetes in the Diabetes Prevention Program
Abstract
Objective: To determine whether baseline adiponectin levels or intervention-associated change in adiponectin levels were independently associated with progression to diabetes in the Diabetes Prevention Program (DPP).
Research design and methods: Cox proportional hazards analysis was used to evaluate the contribution of adiponectin and treatment-related change in adiponectin to risk of progression to diabetes.
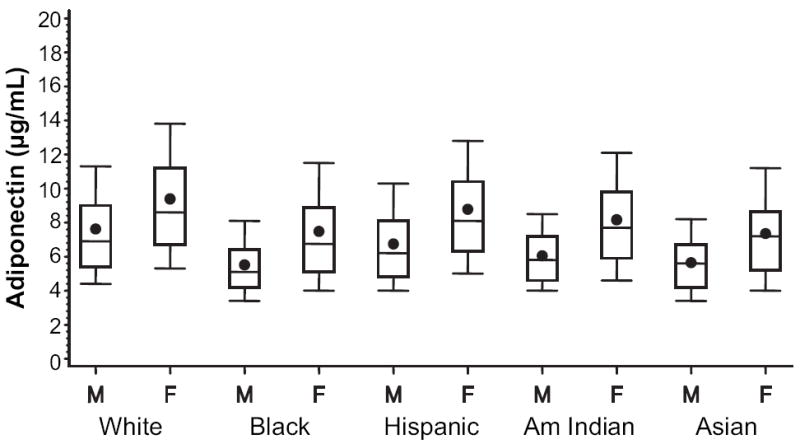
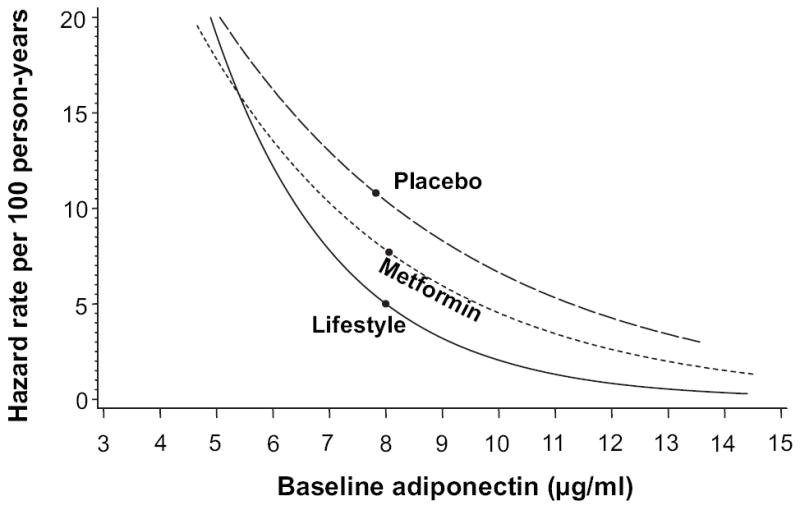
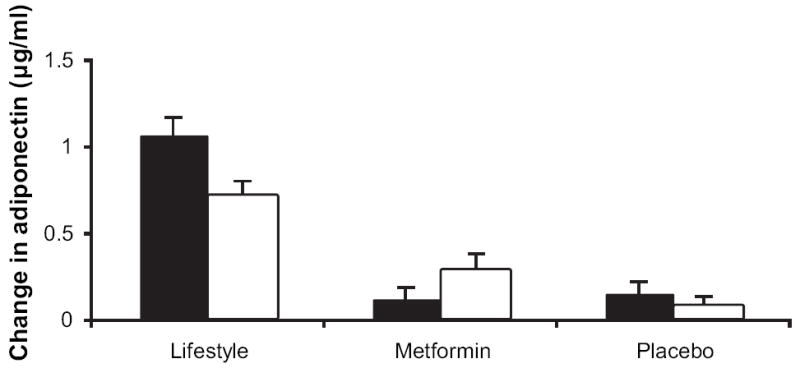
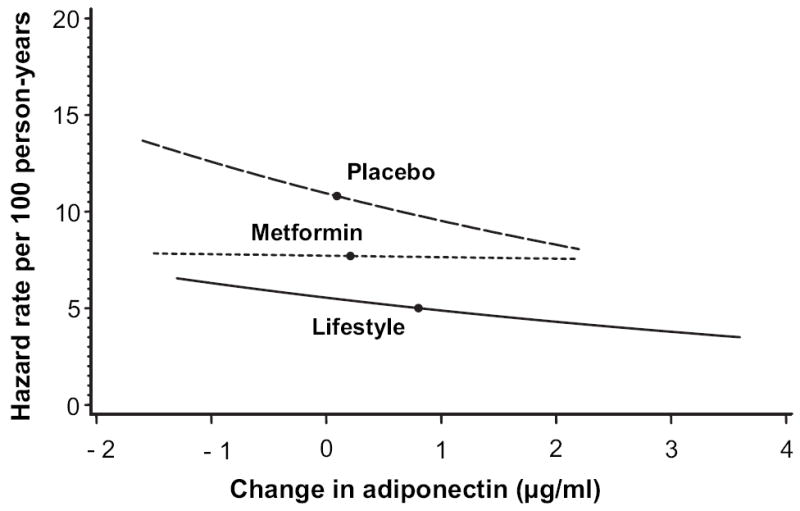
Results: Baseline adiponectin was a strong independent predictor of incident diabetes in all treatment groups (hazard ratio per approximately 3 microg/ml higher level; 0.61 in the lifestyle, 0.76 in the metformin, and the 0.79 in placebo groups; all P < 0.001, P = 0.13 comparing groups). Baseline differences in adiponectin between sexes and race/ethnicity groups were not reflected in differences in diabetes risk. DPP interventions increased adiponectin levels ([means +/- SE] 0.83 +/- 0.05 microg/ml in the lifestyle group, 0.23 +/- 0.05 microg/ml in the metformin group, and 0.10 +/- 0.05 microg/ml in the placebo group; P < 0.001 for increases versus baseline, P < 0.01 comparing groups). These increases were associated with reductions in diabetes incidence independent of baseline adiponectin levels in the lifestyle and placebo groups but not in the metformin subjects (hazard ratio 0.72 in the lifestyle group (P < 0.001), 0.92 in the metformin group (P = 0.18), and 0.89 in the placebo group; P = 0.02 per approximately 1 microg/ml increase, P = 0.02 comparing groups). In the lifestyle group, adjusting for change in weight reduced, but did not remove, the effect of increased adiponectin.
Conclusions: Adiponectin is a powerful marker of diabetes risk in subjects at high risk for diabetes, even after adjustment for weight. An increase in adiponectin in the lifestyle and placebo groups was associated with a reduction in diabetes risk. However, these changes in adiponectin were comparatively small and less strongly related to diabetes outcome than baseline adiponectin levels.
Figures
References
-
- Snehalatha C, Mukesh B, Simon M, et al. Plasma adiponectin is an independent predictor of type 2 diabetes in Asian Indians. Diabetes Care. 2003;26:3226–3229. - PubMed
-
- Halperin F, Beckman JA, Patti ME, et al. The role of total and highmolecular-weight complex of adiponectin in vascular function in offspring whose parents both had type 2 diabetes. Diabetologia. 2005;48:2147–2154. - PubMed
-
- Goldstein BJ, Scalia R. Adipokines and vascular disease in diabetes. Curr Diab Rep. 2007;7:25–33. - PubMed
-
- Lindsay RS, Funahashi T, Hanson RL, et al. Adiponectin and development of type 2 diabetes in the Pima Indian population. Lancet. 2002;360:57–58. - PubMed
MeSH terms
Substances
Grants and funding
LinkOut - more resources
Full Text Sources
Other Literature Sources
Medical
Miscellaneous
