

Population pharmacokinetic modelling of the enterohepatic recirculation of diclofenac and rofecoxib in rats
- PMID: 18193075
- PMCID: PMC2267282
- DOI: 10.1038/sj.bjp.0707643
Population pharmacokinetic modelling of the enterohepatic recirculation of diclofenac and rofecoxib in rats
Erratum in
- Br J Pharmacol. 2008 Apr;153(8):1762
Abstract
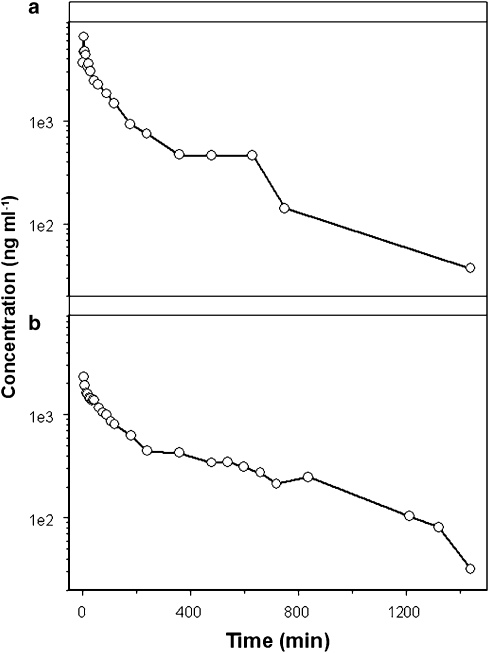
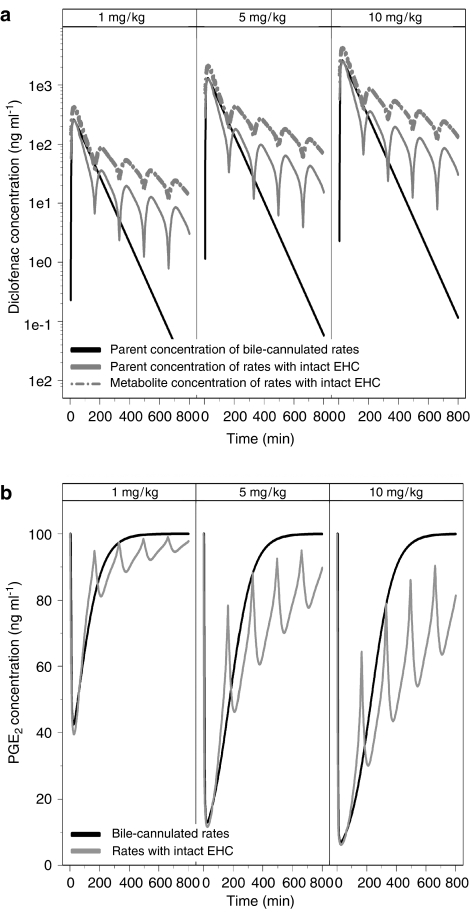
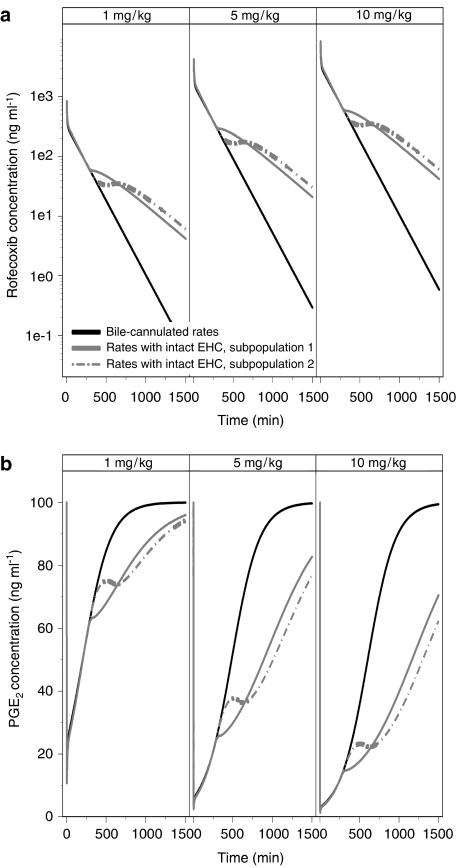
Background and purpose: Enterohepatic recirculation (EHC) is a common pharmacokinetic phenomenon that has been poorly modelled in animals. The presence of EHC leads to the appearance of multiple peaks in the concentration-time profile and increased exposure, which may have implications for drug effect and extrapolation across species. The aim of this investigation was to develop a population pharmacokinetic model for diclofenac and rofecoxib that describes EHC and to assess its consequence for the pharmacodynamics of both drugs.
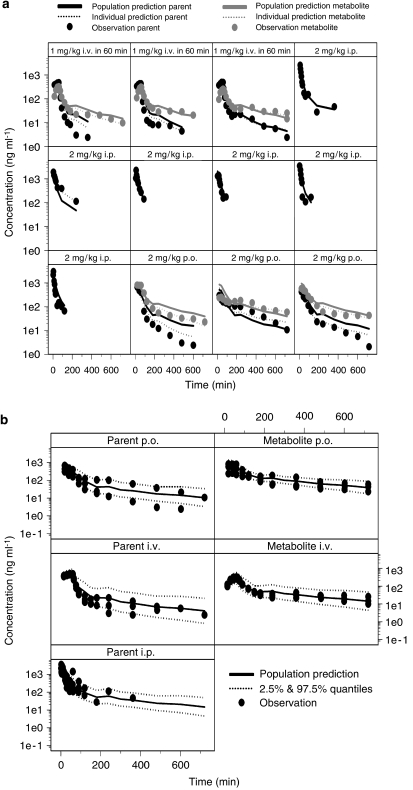
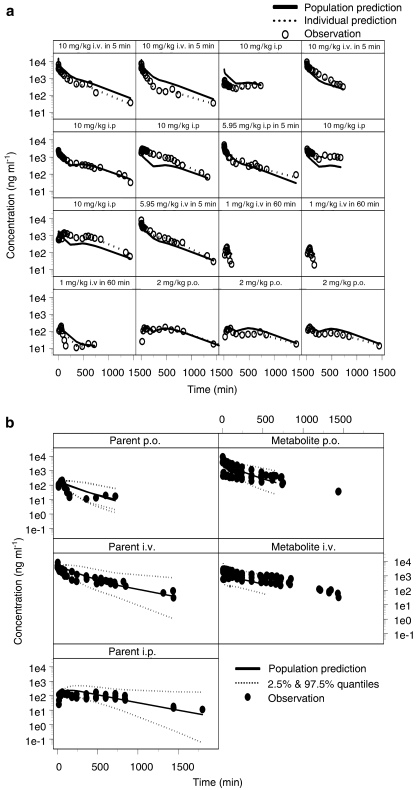
Experimental approach: The pharmacokinetics of diclofenac and rofecoxib was characterized in male rats following intravenous, intraperitoneal and oral administration. Blood samples were collected at pre-defined time points after dosing to determine plasma concentrations over time. A parametric approach using nonlinear mixed effects modelling was applied to describe EHC, whilst simulations were used to evaluate its impact on PGE(2) inhibition.
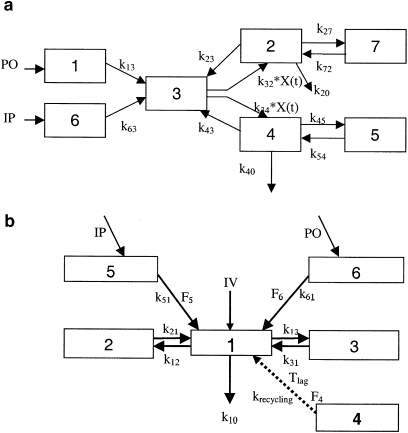
Key results: For diclofenac, EHC was described by a compartmental model with periodic transfer rate and metabolite formation rate. For rofecoxib, EHC modelling required a conversion compartment with first-order recycling rate and lag time. Based on model predictions, EHC causes an increase of 95% in the systemic exposure to diclofenac and of 15% in the exposure to rofecoxib. In addition, EHC prolongs the inhibition of PGE(2) and increases the duration of the anti-inflammatory effect (24 h for rofecoxib 10 mg kg(-1)) without affecting maximum inhibition.
Conclusions and implications: Our findings show the relevance of exploring EHC in a quantitative manner to accurately interpret pharmacodynamic findings in vivo, in particular when scaling across species.
Figures
Similar articles
-
Enhanced plasma concentration by selective deuteration of rofecoxib in rats.Arzneimittelforschung. 2006;56(4):295-300. doi: 10.1055/s-0031-1296724. Arzneimittelforschung. 2006. PMID: 16724516
-
Differential effects of selective cyclooxygenase-2 inhibitors on endothelial function in salt-induced hypertension.Circulation. 2003 Nov 11;108(19):2308-11. doi: 10.1161/01.CIR.0000101683.30157.0B. Epub 2003 Nov 3. Circulation. 2003. PMID: 14597594
-
Rofecoxib [Vioxx, MK-0966; 4-(4'-methylsulfonylphenyl)-3-phenyl-2-(5H)-furanone]: a potent and orally active cyclooxygenase-2 inhibitor. Pharmacological and biochemical profiles.J Pharmacol Exp Ther. 1999 Aug;290(2):551-60. J Pharmacol Exp Ther. 1999. PMID: 10411562
-
[Rofecoxib, a new NSAID preparation with selective COX-2 inhibition].Ugeskr Laeger. 2000 Sep 25;162(39):5233-6. Ugeskr Laeger. 2000. PMID: 11043057 Review. Danish.
-
Rofecoxib: an update on physicochemical, pharmaceutical, pharmacodynamic and pharmacokinetic aspects.J Pharm Pharmacol. 2003 Jul;55(7):859-94. doi: 10.1211/0022357021387. J Pharm Pharmacol. 2003. PMID: 12906745 Review.
Cited by
-
A quantitative enterohepatic circulation model: development and evaluation with tesofensine and meloxicam.Clin Pharmacokinet. 2009;48(8):529-42. doi: 10.2165/11313370-000000000-00000. Clin Pharmacokinet. 2009. PMID: 19705923 Clinical Trial.
-
Population Pharmacokinetic Modeling of the Enterohepatic Recirculation of Fimasartan in Rats, Dogs, and Humans.AAPS J. 2015 Sep;17(5):1210-23. doi: 10.1208/s12248-015-9764-2. Epub 2015 May 20. AAPS J. 2015. PMID: 25990964 Free PMC article. Clinical Trial.
-
Population Pharmacokinetic Modelling of Morphine, Gabapentin and their Combination in the Rat.Pharm Res. 2016 Nov;33(11):2630-43. doi: 10.1007/s11095-016-1988-z. Epub 2016 Jul 5. Pharm Res. 2016. PMID: 27380190
-
Cattle bile aggravates diclofenac sodium-induced small intestinal injury in mice.Evid Based Complement Alternat Med. 2011;2011:315858. doi: 10.1155/2011/315858. Epub 2011 Apr 11. Evid Based Complement Alternat Med. 2011. PMID: 21584236 Free PMC article.
-
Ciprofloxacin blocked enterohepatic circulation of diclofenac and alleviated NSAID-induced enteropathy in rats partly by inhibiting intestinal β-glucuronidase activity.Acta Pharmacol Sin. 2016 Jul;37(7):1002-12. doi: 10.1038/aps.2016.54. Epub 2016 May 16. Acta Pharmacol Sin. 2016. PMID: 27180979 Free PMC article.
References
-
- Alvarez-Bujidos L, Ortiz AI, Molina-Martinez IT, Cubria C, Ordonez D. Pharmacokinetics of intravenous luxabendazole in rabbits: influence of the enterohepatic circulation. Biopharm Drug Dispos. 1998;19:341–347. - PubMed
-
- Baillie TA, Halpin RA, Matuszewski BK, Geer LA, Chavez-Eng CM, Dean D, et al. Mechanistic studies on the reversible metabolism of rofecoxib to 5-hydroxyrofecoxib in the rat: evidence for transient ring opening of a substituted 2-furanone derivative using stable isotope-labeling techniques. Drug Metab Dispos. 2001;29:1614–1628. - PubMed
-
- Beal SL, Sheiner LB. NONMEM User's Guide. NONMEM Project Group, University of California at San Fransisco: San Fransisco, CA; 1999.
-
- Bressolle F, Gomeni R. Predictive performance of a semiparametric method to estimate population pharmacokinetic parameters using NONMEM. J Pharmacokinet Biopharm. 1998;26:349–361. - PubMed
-
- Chan CC, Boyce S, Brideau C, Charleson S, Cromlish W, Ethier D, et al. Rofecoxib [Vioxx, MK-0966; 4-(4′-methylsulfonylphenyl)-3-phenyl-2-(5H)-furanone]: a potent and orally active cyclooxygenase-2 inhibitor. Pharmacological and biochemical profiles. J Pharmacol Exp Ther. 1999;290:551–560. - PubMed
MeSH terms
Substances
LinkOut - more resources
Full Text Sources
Other Literature Sources
