. 2008 Jan;4(1):e6.
doi: 10.1371/journal.ppat.0040006.

Distinct TLR- and NLR-mediated transcriptional responses to an intracellular pathogen

Affiliations

Distinct TLR- and NLR-mediated transcriptional responses to an intracellular pathogen

Jess H Leber et al. PLoS Pathog. 2008 Jan.

Abstract

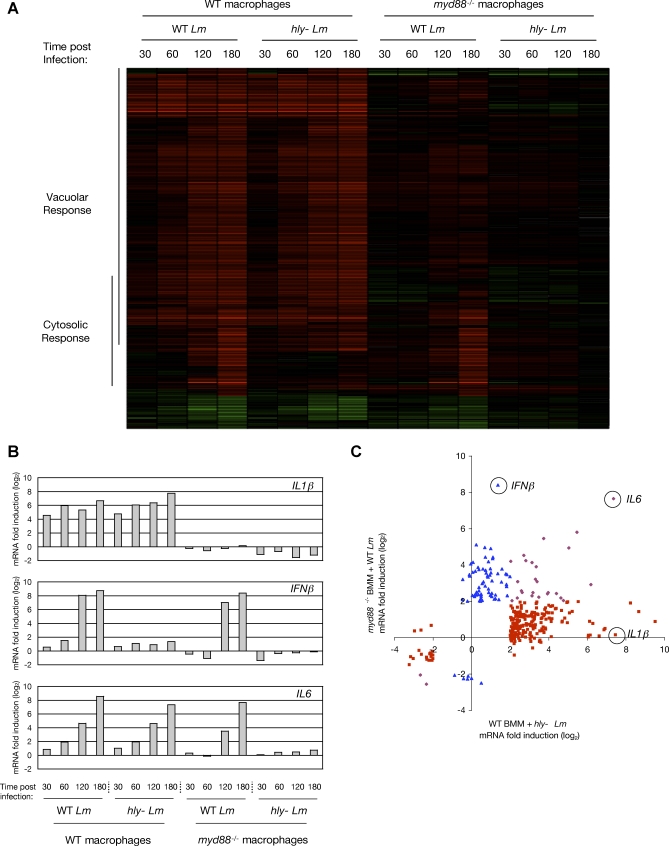
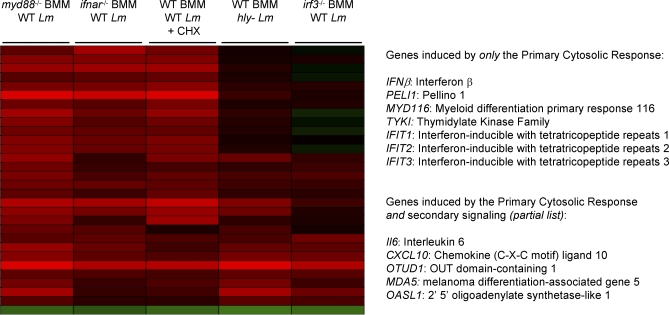
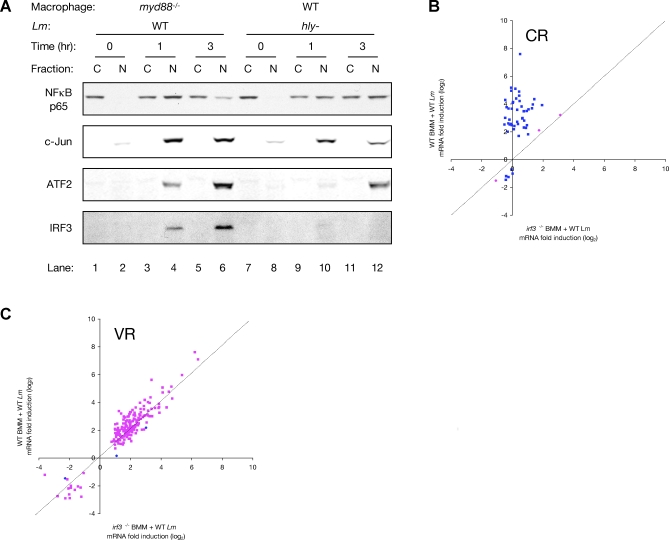
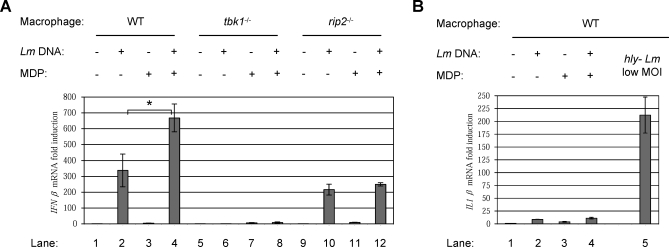
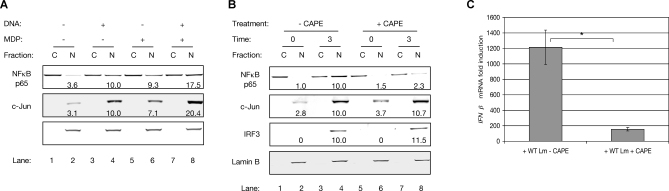
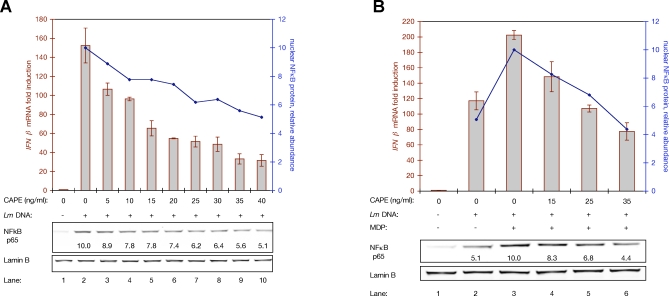
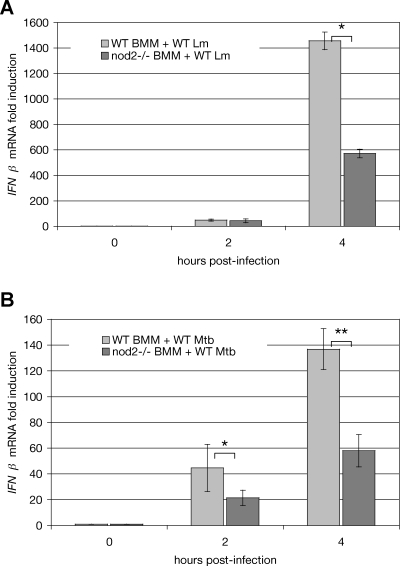
How the innate immune system tailors specific responses to diverse microbial infections is not well understood. Cells use a limited number of host receptors and signaling pathways to both discriminate among extracellular and intracellular microbes, and also to generate responses commensurate to each threat. Here, we have addressed these questions by using DNA microarrays to monitor the macrophage transcriptional response to the intracellular bacterial pathogen Listeria monocytogenes. By utilizing combinations of host and bacterial mutants, we have defined the host transcriptional responses to vacuolar and cytosolic bacteria. These compartment-specific host responses induced significantly different sets of target genes, despite activating similar transcription factors. Vacuolar signaling was entirely MyD88-dependent, and induced the transcription of pro-inflammatory cytokines. The IRF3-dependent cytosolic response induced a distinct set of target genes, including IFNbeta. Many of these cytosolic response genes were induced by secreted cytokines, so we further identified those host genes induced independent of secondary signaling. The host response to cytosolic bacteria was reconstituted by the cytosolic delivery of L. monocytogenes genomic DNA, but we observed an amplification of this response by NOD2 signaling in response to MDP. Correspondingly, the induction of IFNbeta was reduced in nod2-/- macrophages during infection with either L. monocytogenes or Mycobacterium tuberculosis. Combinatorial control of IFNbeta induction by recognition of both DNA and MDP may highlight a mechanism by which the innate immune system integrates the responses to multiple ligands presented in the cytosol by intracellular pathogens.


Conflict of interest statement

Competing interests. DAP has a consulting relationship with and a financial interest in Cerus Corporation, which may benefit from commercialization of the results of this research.

Figures

Figure 1
Figure 1. Macrophages Have Distinct Transcriptional Responses to Vacuolar and Cytosolic L. monocytogenes Infection
(A) Cluster analysis of the microarray determination of all mouse macrophage genes with at least a 4-fold change in abundance during infection of WT and myd88−/− macrophages with either WT or hly− L. monocytogenes, at the indicated times post-infection (in minutes). Red indicates an increase in RNA abundance relative to uninfected macrophages, and green indicates a decrease. Genes identified by SAM and at least 4-fold induced in WT macrophages by hly− L. monocytogenes are indicated as targets of the “Vacuolar Response”. Genes identified by SAM and at least 4-fold induced in myd88 −/− macrophages by WT L. monocytogenes are indicated as targets of the “Cytosolic Response”. For target gene lists, see Datasets S1 and S2. The determination of Vacuolar Response and Cytosolic Response target genes was from multiple arrays representing four independent experiments (e.g. four independent dishes of uninfected myd88 −/− macrophages and four independent dishes of myd88 −/− macrophages infected with WT L. monocytogenes for 180 minutes were used for Cytosolic Response determination). (B) Summary of the transcriptional responses of IL1β, IFNβ, and IL6 in WT and myd88 −/− macrophages during infection with either WT or hly− L. monocytogenes, at the indicated times post-infection (in minutes), determined by microarray analyses (Dataset S5). (C) Scatter plot representation of the transcriptional response of all genes defined as targets of the Vacuolar Response or the Cytosolic Response. Microarray data from myd88 −/− macrophages infected with WT L. monocytogenes (Cytosolic Response-stimulating conditions) is plotted on the Y-axis, and microarray data from WT macrophages infected with hly− L. monocytogenes (Vacuolar Response-stimulating conditions) is plotted on the X-axis. Targets of only the Vacuolar Response are depicted as red squares (e.g. IL1β), targets of only the Cytosolic Response as blue triangles (e.g. IFNβ), and targets of both the Vacuolar Response and Cytosolic Response as purple diamonds (e.g. IL6).
Figure 2
Figure 2. Determination of the Primary Cytosolic Response
Cluster analysis of the microarray data used to determine the targets of the Primary Cytosolic Response, which are directly induced by NLR signaling in response to L. monocytogenes. The analyses used to determine these targets are described in Results. For the full target list, see Dataset S3.
Figure 3
Figure 3. Specificity of the Cytosolic and Vacuolar Responses
(A) Western blot analysis of the distribution of transcription factors NFκB p65, phospho-c-Jun, phospho-ATF2, and IRF3 in fractionated lysates of myd88 −/− or WT macrophages infected with WT or hly− L. monocytogenes, respectively, for the indicated times (in hours). “C” indicates cytosolic fractions and “N” indicates nuclear fractions. Data is from the pooled lysates of two independent dishes. (B) Scatter plot representation of the transcriptional response of WT and irf3 −/− macrophages infected for 3 hours with WT L. monocytogenes, as determined by microarrays. Shown are the responses of Cytosolic Response-specific target genes. Y-axis values are log2 fold change in RNA abundance in WT macrophages infected with WT L. monocytogenes. X-axis values are log2 fold change in RNA abundance in irf3 −/− macrophages infected with WT L. monocytogenes. The superimposed dashed line has a slope = 1. Spots in blue are those identified by SAM as being significantly differently induced in the two conditions, while spots in pink are not different. (C) Scatter plot representation of the transcriptional response of WT and irf3 −/− macrophages infected for 3 hours with WT L. monocytogenes, as determined by microarrays. Shown are the responses of Vacuolar Response-specific target genes. Y-axis values are log2 fold change in RNA abundance in WT macrophages infected with WT L. monocytogenes. X-axis values are log2 fold change in RNA abundance in irf3 −/− macrophages infected with WT L. monocytogenes. The superimposed dashed line has a slope = 1. Spots in blue are those identified by SAM as being significantly differently induced in the two conditions, while spots in pink are not different.
Figure 4
Figure 4. Cytosolic Delivery of L. monocytogenes DNA and Synthetic MDP Synergistically Induce the Cytosolic Response
(A) Analysis by qPCR of IFNβ transcriptional induction in WT, tbk1 −/−, and rip2 −/− macrophages 6 hours after transfection with the indicated combinations of L. monocytogenes genomic DNA (250 ng/ml) and synthetic MDP (10 μg/ml). The “*” indicates that these values are significantly different statistically with a p-value of 0.07. (B) Analysis by qPCR of IL1β transcriptional induction in WT macrophages 6 hours after transfection with the indicated combinations of L. monocytogenes genomic DNA and synthetic MDP, or 4 hours after infection with hly− L. monocytogenes at a low MOI.
Figure 5
Figure 5. Induction of the Cytosolic Response Requires Nuclear NFκB
(A) Quantitative Western blot analysis of NFκB p65, c-Jun, and ATF2 distribution in fractionated lysates of WT macrophages transfected with the indicated combinations of L. monocytogenes genomic DNA and synthetic MDP. “C” indicates cytosolic fractions and “N” indicates nuclear fractions. Nuclear abundance of proteins (indicated below the nuclear fraction within each blot) was normalized to the nuclear protein Lamin B, which also serves as fractionation control. For each transcription factor, abundance in the nucleus of macrophages transfected with L. monocytogenes DNA was arbitrarily set to 10.0, and all other abundances were calculated relative to this. Data was collected from two blots, with each blot using pooled lysates of two independent dishes. (B) Quantitative Western blot analysis of NFκB p65, c-Jun, and IRF3 protein distribution in fractionated lysates of WT macrophages infected with WT L. monocytogenes for the indicated times (in hours). Where indicated, cells were additionally treated with 10 μg/ml CAPE. (C) Analysis by qPCR of IFNβ transcriptional induction in WT macrophages infected with WT L. monocytogenes for 3 hours. Where indicated, cells were additionally treated with 10 μg/ml CAPE. The “*” indicates that these values are significantly different statistically with a p-value of 0.03.
Figure 6
Figure 6. Synergistic Induction of IFNβ Is Sensitive to NFκB Nuclear Abundance
(A) Dual analysis of IFNβ transcriptional induction and nuclear NFκB abundance in WT macrophages transfected with L. monocytogenes DNA, and additionally treated with CAPE at the indicated concentrations. IFNβ transcriptional analysis (red columns and left Y-axis) was by qPCR. Nuclear NFκB abundance (blue line and right Y-axis) was by quantitative Western blot analysis of the nuclear fractions of fractionated cells; blot is shown at the bottom, along with calculated relative NFκB abundances. (B) Dual analysis of IFNβ transcriptional induction and nuclear NFκB abundance in WT macrophages transfected with the indicated combinations of L. monocytogenes genomic DNA and MDP, and additionally treated with CAPE at the indicated concentrations. IFNβ transcriptional analysis (columns and left Y-axis, in red) was by qPCR. Nuclear NFκB abundance (line and right Y-axis, in blue) was by quantitative Western blot analysis; blot is shown at the bottom, along with calculated relative NFκB abundances.
Figure 7
Figure 7. NOD2 Is Required for Full IFNβ Induction during Infection with Either L. monocytogenes or M. tuberculosis
(A) Analysis by qPCR of IFNβ transcriptional induction in tolerized WT and nod2 −/− macrophages infected with WT L. monocytogenes. The “*” indicates that these values are significantly different statistically with a p-value of 0.003. (B) Analysis by qPCR of IFNβ transcriptional induction in tolerized WT and nod2 −/− macrophages infected with WT M. tuberculosis. The “*” indicates that these values are significantly different statistically with a p-value of 0.05. The “**” indicates that these values are significantly different statistically with a p-value of 0.001.

References

    1. Aderem A. Phagocytosis and the inflammatory response. J Infect Dis. 2003;187(Suppl 2):S340–S345. - PubMed
    1. Stuart LM, Ezekowitz RA. Phagocytosis: elegant complexity. Immunity. 2005;22:539–550. - PubMed
    1. Herskovits AA, Auerbuch V, Portnoy DA. Bacterial ligands generated in a phagosome are targets of the cytosolic innate immune system. PLoS Pathog. 2007;3:e51. doi: 10.1371/journal.ppat.0030051. - DOI - PMC - PubMed
    1. Medzhitov R, Janeway C., Jr. Innate immune recognition: mechanisms and pathways. Immunol Rev. 2000;173:89–97. - PubMed
    1. Beutler B, Jiang Z, Georgel P, Crozat K, Croker B, et al. Genetic analysis of host resistance: Toll-like receptor signaling and immunity at large. Annu Rev Immunol. 2006;24:353–389. - PubMed

Publication types

MeSH terms

Substances