. 2008 Jan;4(1):e6.
doi: 10.1371/journal.pgen.0040006.

The molecular mechanisms of OPA1-mediated optic atrophy in Drosophila model and prospects for antioxidant treatment

Affiliations

The molecular mechanisms of OPA1-mediated optic atrophy in Drosophila model and prospects for antioxidant treatment

Will Yarosh et al. PLoS Genet. 2008 Jan.

Abstract

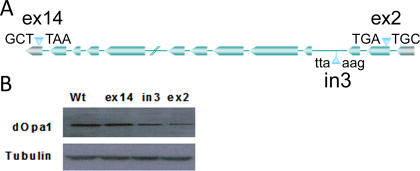
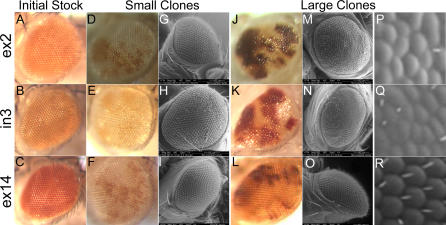
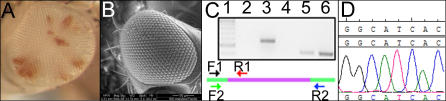
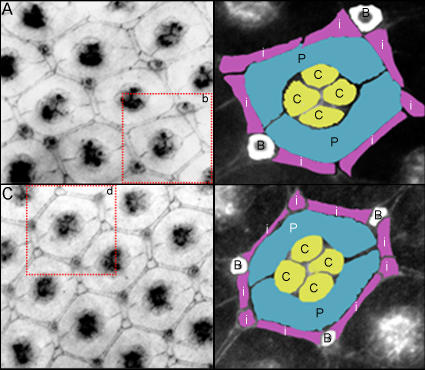
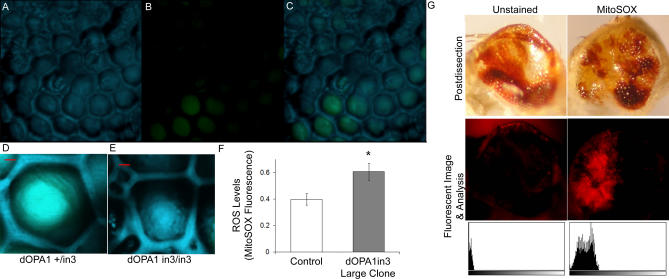
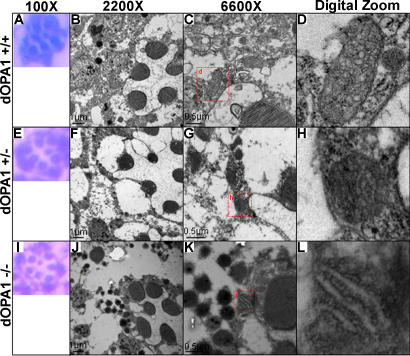
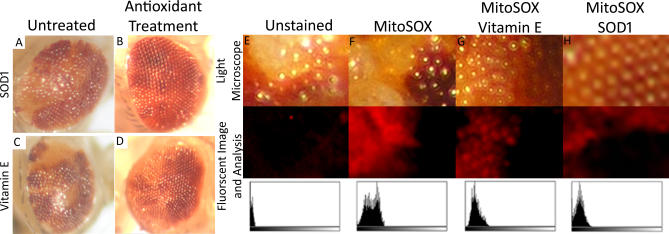
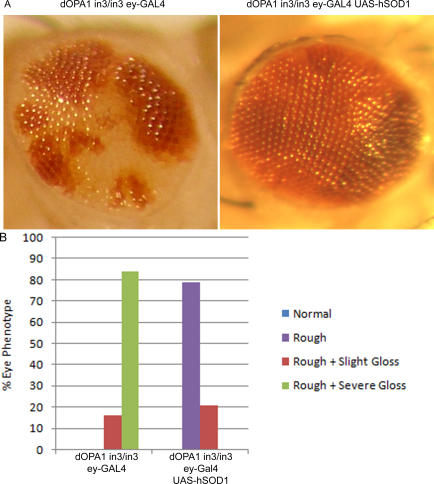
Mutations in optic atrophy 1 (OPA1), a nuclear gene encoding a mitochondrial protein, is the most common cause for autosomal dominant optic atrophy (DOA). The condition is characterized by gradual loss of vision, color vision defects, and temporal optic pallor. To understand the molecular mechanism by which OPA1 mutations cause optic atrophy and to facilitate the development of an effective therapeutic agent for optic atrophies, we analyzed phenotypes in the developing and adult Drosophila eyes produced by mutant dOpa1 (CG8479), a Drosophila ortholog of human OPA1. Heterozygous mutation of dOpa1 by a P-element or transposon insertions causes no discernable eye phenotype, whereas the homozygous mutation results in embryonic lethality. Using powerful Drosophila genetic techniques, we created eye-specific somatic clones. The somatic homozygous mutation of dOpa1 in the eyes caused rough (mispatterning) and glossy (decreased lens and pigment deposition) eye phenotypes in adult flies; this phenotype was reversible by precise excision of the inserted P-element. Furthermore, we show the rough eye phenotype is caused by the loss of hexagonal lattice cells in developing eyes, suggesting an increase in lattice cell apoptosis. In adult flies, the dOpa1 mutation caused an increase in reactive oxygen species (ROS) production as well as mitochondrial fragmentation associated with loss and damage of the cone and pigment cells. We show that superoxide dismutase 1 (SOD1), Vitamin E, and genetically overexpressed human SOD1 (hSOD1) is able to reverse the glossy eye phenotype of dOPA1 mutant large clones, further suggesting that ROS play an important role in cone and pigment cell death. Our results show dOpa1 mutations cause cell loss by two distinct pathogenic pathways. This study provides novel insights into the pathogenesis of optic atrophy and demonstrates the promise of antioxidants as therapeutic agents for this condition.


Conflict of interest statement

Competing interests. The authors have declared that no competing interests exist.

Figures

Figure 1
Figure 1. Insertion in dOPA1 Can Disrupt dOPA1 Expression
The location of each within dOpa1 and the nucleotide sequences flanking the insertion site in the Drosophila lines used in this study (A). Western blot analysis of several Drosophila lines containing insertions near or within dOpa1. (B) shows dOpa1 levels in adult Drosophila wild-type dOpa1 (dOpa1 +/+), Drosophila with a transposon insertion in exon 14 (noncoding region) (dOpa1 +/ex14), intron 3 (dOpa1 +/in3), and exon 2(dOpa1 +/ex14). Tubulin was used as a loading control.
Figure 2
Figure 2. Homozygous Mutation of dOpa1 Results in a Rough and Glossy Phenotype in the Somatic Clones of the Adult Drosophila Eye
(A–C) Bright field microscopy images of the adult eyes of the original heterozygous insertion lines are shown in (A), (B), and (C) for dOpa1 +/ex2, dOpa1 +/in3, and dOpa1 +/ex14, respectively. None of these stocks contained any gross eye phenotype. The mosaic-eyed flies produced by the F2 cross (small clones) contain dOpa1 +/+, dOpa1 +/−, or dOpa1 −/− cell types, which are white, light orange, and dark orange, respectively. (D–I) (D), (E), and (F) are bright field images and (G), (H), and (I) are SEM micrographs of the small clones dOpa1 ex2, dOpa1 in3, and dOpa1 ex14 mutations, respectively. A weak rough phenotype with low penetrance was observed in the small clones of the dOPA1 ex2 and dOPA1 in3 mutations, but not the dOPA1 ex14 mutation. (J–R) (J), (K), and (L) are bright field images; (M), (N), and (O) are SEM micrographs; and (P,Q,R) are 10× digital zooms of areas of interest in the large clones of the dOpa1 ex2, dOpa1 in3, and dOpa1 ex14 mutations, respectively. Glossy and rough phenotypes were observed with 100% penetrance in the large clones of the dOPA1 ex2 and dOPA1 in3 mutations, but not the dOPA1 ex14 mutation.
Figure 3
Figure 3. Reversal of the dOpa1 Large Clone Eye Phenotype by P-Element Excision
The phenotypes present in large clones of the dOpa1 ex2 mutation were reversed, as documented by bright field microscopy (A) and SEM (B), by excision of the P-element. The excision of the P-element insertion was verified by PCR (C). Lane 1 contains 1 μg of the 100 base pair ladder (NEB) for reference. Lane 2 is a negative reagent control without template DNA. Lane 3 contains DNA from dOpa1 +/ex2 amplified with the F1 primer, which anneals in the exon 2 flanking the P-element insertion and the R1 primer annealing inside the P-element. Lane 4 contains DNA from excised flies amplified with the F1 and R1 primers. Lane 5 contains DNA from dOpa1 +/ex2 and is amplified using F1 and R2. Lane 6 contains DNA excised from flies amplified with F1 and R2. A schematic representation of the annealing sites of the primer sets used in (C). We further verified the P-element excision by sequencing of the PCR product generated in lane 6 (D) and comparing with the known wild-type (wt) sequence.
Figure 4
Figure 4. Homozygous Mutation of dOpa1 Causes a Loss of Interommatidial Cells
Pupae were staged 42 h after pupae formation (APF), and large clone mosaics with GFP expression in the eye imaginal disk were collected and stained with Hoechst and for Armadillo. Eye discs were then analyzed and regions of dOpa1 in3/in3 and/or dOpa1 +/in4 ommatidial units were photographed and presented (A,C), using only channels with Armadillo signal. (A) illustrates a region of the dOpa1 in3/in3 ommatidial units. A red box marked with a b is used to indicate the ommatidial unit illustrated in (B). The different cell types are highlighted (B). The cone cells, c, are illustrated in yellow, the pigment cells, p, in blue, the IOCs in purple, and the bristle cells, b, in white. (C) shows the ommatidial units of a dOpa1 +/in3 Minute+/− ubi-GFP+/− clonal region. A red box marked with a d indicates the ommatidial unit is shown in (D). No cell types are missing, and no disorganization is present. Cell types are represented as in (B).
Figure 5
Figure 5. Homozygous dOpa1 Mutations Produce Morphologically Perturbed Ommatidial Units
Confocal microscopy analysis of the eyes of anesthetized adult dOpa1 in3/in3 large clones. A 3D reconstruction of a large clone with dOpa1 +/in3 and dOpa1 in3/in3 ommatidia was generated from reflectance (A), GFP fluorescence (B), and merged signals (C). dOpa1 +/in3 and dOpa1 in3/in3 ommatidial units from (C) were magnified and are shown in (D) and (E), respectively. Note the abnormal morphological features of the cone cells in the dOpa1 in3/in3 ommatidium. The red bar equals 2 microns. (F) shows that dOpa1 in3 mutation causes higher ROS levels than control eyes. The MitoSOX fluorescent signals were measured in tissue homogenates from dissected control eyes (wild-type) and dOpa1 in3 large clone eyes. The data represent the mean ± standard deviation of three experiments, using 10-d-old flies and a total of 40 flies per genotype, * < 0.05. ROS level indicated as MitoSOX fluorescence intensity normalized to microgram of eye tissue homogenate. dOpa1in3 large clones exhibit relatively higher levels of ROS in dOPA1−/− cells than dOpa1+/− mutant cells. Adult dOpa1 mutant large clone eyes were promptly dissected, stained, and imaged using MitoSOX in HBSS (G). MitoSOX fluorescent signal histogram plots (bottom row) of fluorescent images (middle row) were generated using jImage (values 0–256, left to right); corresponding light microscope images (top row) illustrate the eye after dissection and MitoSOX staining.
Figure 6
Figure 6. The dOpa1 Mutation Affects Mitochondrial Morphology and Tissue Integrity
Whole flies were sectioned and analyzed by hematoxylin and eosin (H&E) staining and standard microscopy (A), (E), (I) or TEM (B–D), (F–H), (J–L). (C), (G), and (H) contain red boxes with d, g, and i in them, respectively, indicating the region digitally zoomed in (D), (H), and (I). As shown in (A–C), there are no differences in the number of rhabdomeres among dOpa1 +/+ (A), dOpa1 +/in3 (E), and dOpa1 in3/in3 (I) ommatidial units (n > 40). Note: TEM analysis of similar sections revealed a significant difference in mitochondrial morphology along with abnormalities in the cells surrounding the rhabdomeres. dOpa1 +/+ ommatidial units contained many mitochondria (B–D). dOpa1 +/in3 ommatidial units contained fragmented mitochondria (F–H). dOpa1 in3/in3 ommatidial units had few mitochondria (J–L), which all had very perturbed morphology. Severe tissue damage is visible in regions within dOpa1 in3/in3 ommatidial units. dOpa1 in3/in3 ommatidial units were classified based on the morphology (number of sides) of the ommatidial units; we had previously observed that dOpa1 in3/in3 ommatidial units adjacent to other dOpa1 in3/in3 ommatidial units had four rather than normal six sides.
Figure 7
Figure 7. Partial Reversal of the Rough, Glossy Phenotype of dOpa1 Mutants by the Antioxidants SOD-1 and Vitamin E
dOpa1in3 large clones were either untreated, (A) and (C), or treated with 1,000 units/ml SOD-1 (B) or 20 μg/ml vitamin E (D). Antioxidant treatment resulted in partial reversal of the rough eye phenotype. dOpa1 mutant large clones that received no treatment (E, F), vitamin E (G), or SOD-1 (H) were dissected and stained with MitoSOX (F–H) to visualize ROS levels. dOpa1 mutant large clones treated with antioxidants displayed lower levels of MitoSOX fluorescence in dOpa1−/− cells compared to untreated samples. MitoSOX fluorescent signal histogram plots (bottom row) of fluorescent images (middle row) were generated using JImage (Values 0–256, left to right); corresponding light microscope images (top row) illustrate the eye after dissection and MitoSOX staining.
Figure 8
Figure 8. Overexpression of hSOD1 Reverses the Glossy Eye Phenotype of dOPA1 Mutant Large Clones
Bright field microscopy images of the adult eyes with (A) (left), and without (A) (right) hSOD1 gene. Adult dOPA1 mutant large clones were scored for the severity of a glossy eye phenotype (B). Eyes that contained more than 20% glossy ommatidial units in dOPA1 homozygous mutant (or wild-type chromosomal arm equivalent) were given a score of severe gloss. Eyes of an intermediate phenotype (less than 20% glossy ommatidial units) were given a score of slight gloss. dOPA1in3 UAS-hSOD1; ey-Gal4 large clones were generated using UAS-hSOD1 transgenic flies, kindly provided by R. Bodmer (35) (Figure S6), eyeless-GAL4 (ey-Gal4) transgenic flies (Bloomington). Presence of dOPA1in3, UAS-hSOD1, and ey-Gal4 were all verified by PCR with primers as described in Materials and Methods.

References

    1. Bette S, Schlaszus H, Wissinger B, Meyermann R, Mittelbronn M. OPA1, associated with autosomal dominant optic atrophy, is widely expressed in the human brain. Acta Neuropathol (Berl) 2005;109:393–399. - PubMed
    1. Kjer B, Eiberg H, Kjer P, Rosenberg T. Dominant optic atrophy mapped to chromosome 3q region. II. Clinical and epidemiological aspects. Acta Ophthalmol Scand. 1996;74:3–7. - PubMed
    1. Votruba M, Aijaz S, Moore AT. A review of primary hereditary optic neuropathies. J Inherit Metab Dis. 2003;26:209–227. - PubMed
    1. Carelli V, Ross-Cisneros FN, Sadun AA. Mitochondrial dysfunction as a cause of optic neuropathies. Prog Retin Eye Res. 2004;23:53–89. - PubMed
    1. Votruba M, Moore AT, Bhattacharya SS. Clinical features, molecular genetics, and pathophysiology of dominant optic atrophy. J Med Genet. 1998;35:793–800. - PMC - PubMed

Publication types

MeSH terms