. 2008 Jul;124(3):388-400.
doi: 10.1111/j.1365-2567.2007.02787.x. Epub 2008 Jan 11.

Cytomegalovirus infection induces T-cell differentiation without impairing antigen-specific responses in Gambian infants

Affiliations

Cytomegalovirus infection induces T-cell differentiation without impairing antigen-specific responses in Gambian infants

David J C Miles et al. Immunology. 2008 Jul.

Abstract

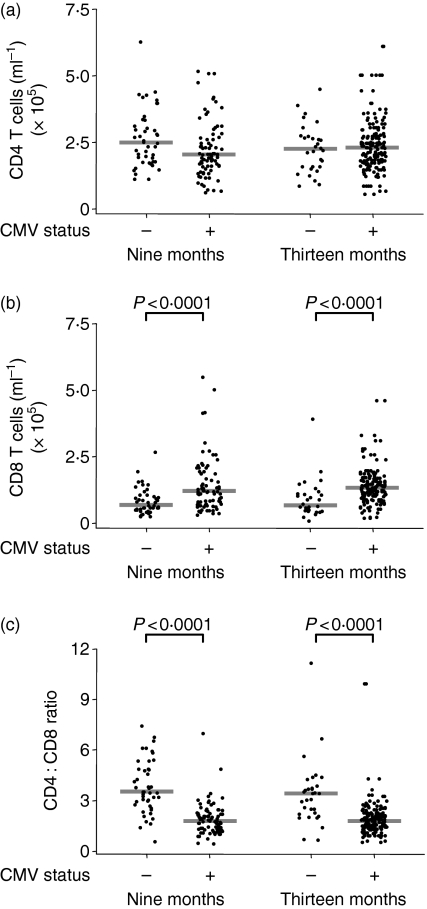
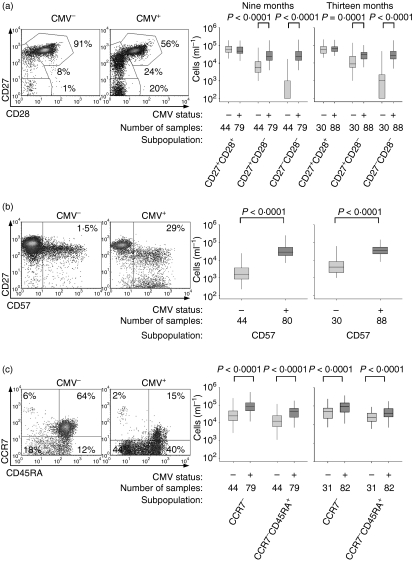
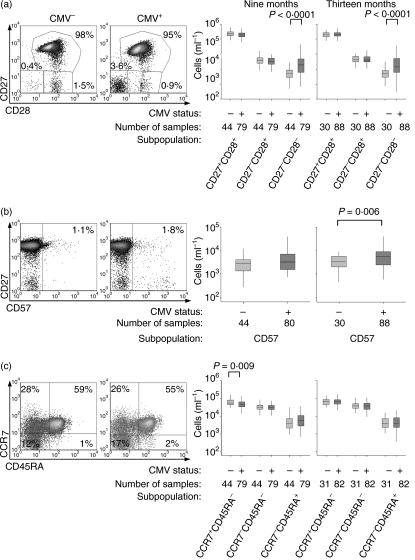
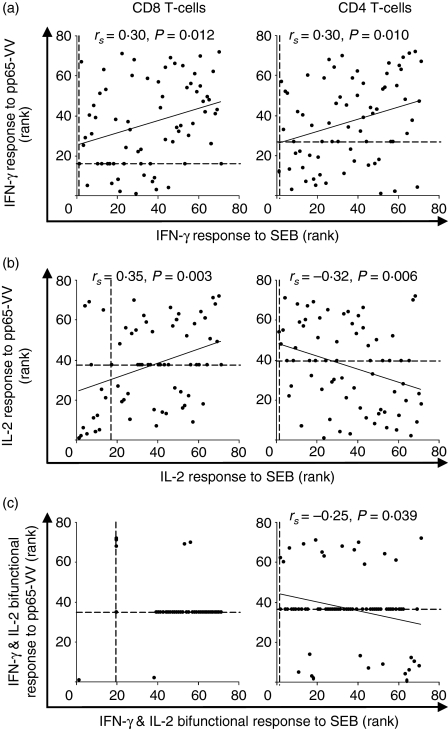
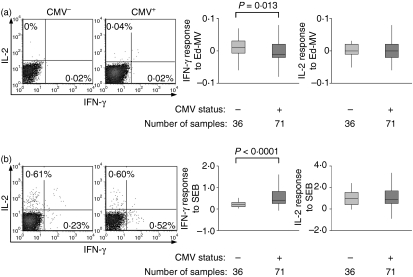
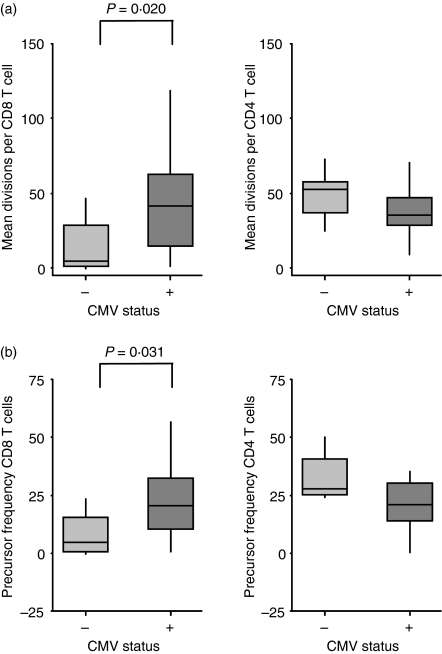
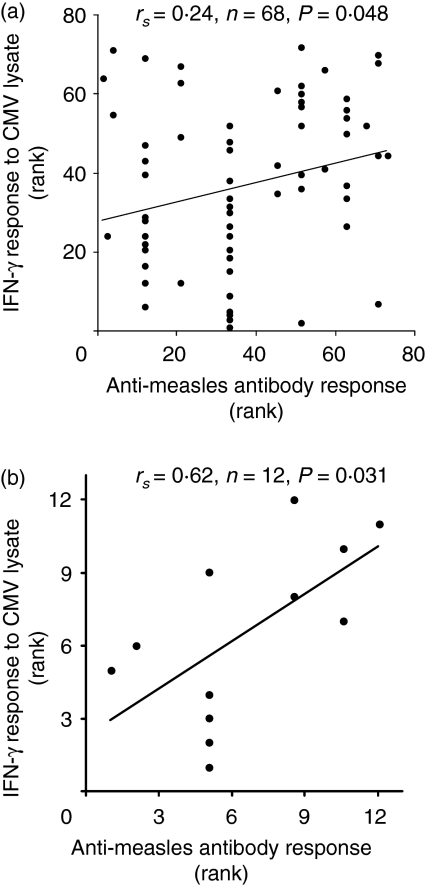
Cytomegalovirus (CMV) infection induces profound differentiation of T cells, and is associated with impaired responses to other immune challenges. We therefore considered whether CMV infection and the consequent T-cell differentiation in Gambian infants was associated with impaired specific responses to measles vaccination or polyclonal responses to the superantigen staphylococcal enterotoxin B (SEB). While the concentration of undifferentiated (CD27(+) CD28(+) CCR7(+)) T-cells in peripheral blood was unaffected by CMV, there was a large increase in differentiated (CD28(-) CD57(+)) CD8 T-cells and a smaller increase in differentiated CD4 cells. One week post-vaccination, the CD4 cell interferon-gamma (IFN-gamma) response to measles was lower among CMV-infected infants, but there were no other differences between the cytokine responses, or between the cytokine or proliferative responses 4 months post-vaccination. However, the CD8 T cells of CMV-infected infants proliferated more in response to SEB and the antibody response to measles correlated with the IFN-gamma response to CMV, indicating that CMV infection actually enhances some immune responses in infancy.


Figures

Figure 1
Figure 1
Infants infected with cytomegalovirus (CMV) have a higher concentration of CD8 T cells in the peripheral blood. (a) Concentration of CD4 T cells, (b) concentration of CD8 T cells and (c) CD4 : CD8 ratio in CMV-infected and uninfected infants at 9 and 13 months. Bars indicate median values.
Figure 2
Figure 2
Infants infected with cytomegalovirus (CMV) have more differentiated CD8 T cells than uninfected infants. (a) Density plots of CD27 and CD28 expression in the CD8 T-cell population of CMV-infected and uninfected infants, selected as representative as they are the individuals with the median CD27+ CD28+ subpopulations at 9 months, and absolute sizes of all three subpopulations in all subjects. Percentages on scatter plots indicate the relative sizes of the indicated subpopulations. (b) Density plots of CD27 and CD57 expression, selected as representative as they are the individuals with the median CD57+ subpopulations at 9 months, and absolute sizes of all three subpopulations in all subjects. Percentages on scatter plots indicate the relative sizes of the indicated subpopulations. (c) Density plots of CCR7 and CD45RA expression, selected as representative as they are the individuals with the median CCR7 subpopulations at 9 months, and absolute sizes of all three subpopulations in all subjects. Percentages on scatter plots indicate the relative sizes of the subpopulations in each quadrant. Boxplots indicate median and interquartile range.
Figure 3
Figure 3
Infants infected with cytomegalovirus (CMV) have slightly more differentiated CD4 T-cells than uninfected infants. (a) Density plots of CD27 and CD28 expression in the CD4 T-cell population of CMV-infected and uninfected infants, selected as representative as they are the individuals with the median CD27+ CD28+ subpopulations at 9 months, and absolute sizes of all three subpopulations in all subjects. Percentages on scatter plots indicate the relative sizes of the indicated subpopulations. (b) Density plots of CD27 and CD57 expression, selected as representative as they are the individuals with the median CD57+ subpopulations at 9 months, and absolute sizes of all three subpopulations in all subjects. Percentages on scatter plots indicate the relative sizes of the indicated subpopulations. (c) Density plots of CCR7 and CD45RA expression, selected as representative as they are the individuals with the median CCR7+ CD45RA subpopulations at 9 months, and absolute sizes of all three subpopulations in all subjects. Percentages on scatter plots indicate the relative sizes of the subpopulations in each quadrant. Boxplots indicate median and interquartile range.
Figure 4
Figure 4
Responses of CD8 T cells to cytomegalovirus correlate positively with responses to c although the equivalent IL-2 responses of CD4 T cells correlates negatively. (a) Scatter plots of ranked proportions of IFN-γ-producing cells in response to pp65-VV and staphylococcal enterotoxin B (SEB). (b) Scatter plots of ranked proportions of IL-2-producing cells in response to pp65-VV and SEB. (c) Scatter plots of ranked proportions of bifunctional IFN-γ- and IL-2-producing cells in response to pp65-VV and SEB. Data are ranked as correlations are non-parametric, and Spearman's correlation coefficients, significances and fitted lines are shown where correlations were significant. Dashed lines indicate rank of the zero-value.
Figure 5
Figure 5
The short-term CD4 T-cell response to Ed-MV and staphylococcal enterotoxin B (SEB) is slightly modulated by cytomegalovirus (CMV) infection. (a) Scatter plots of the response to Ed-MV, gated on CD4 T cells and selected as representative of CMV-infected and uninfected infants as they had the median IFN-γ response among those that responded, and responses for all samples. (b) Scatter plots of the response to SEB, gated on CD4 T cells and selected as representative of CMV-infected and uninfected infants as they had the median IFN-γ response, and responses for all samples. Boxplots indicate medians and interquartile ranges.
Figure 6
Figure 6
Infection with cytomegalovirus increases the proliferation of CD8 T cells in response to SEB, measured by CFSE dilution. (a) Mean number of divisions per cell, calculated by subtracting the mean number of divisions among surviving cells in the negative control culture from the equivalent number in the SEB-stimulated culture. (b) Precursor frequency, calculated by subtracting the percentage of cells at the end of the culture period that had undergone at least one division in the negative control culture from the equivalent percentage in the SEB-stimulated culture. Boxplots indicate median and interquartile range.
Figure 7
Figure 7
Anti-measles antibody response correlates with IFN-γ response to cytomegalovirus (CMV) at 13 months of age. (a) Ranked anti-measles antibody response measured by HAI plotted against ranked anti-CMV IFN-γ response measured by ELISpot among infants infected with CMV at time of vaccination. (b) Ranked anti-measles antibody response measured by HAI plotted against ranked anti-CMV IFN-γ response measured by ELISpot among infants infected with CMV between vaccination and sampling. Spearman's correlation statistics and lines of best fit are shown.

References

    1. Pass RF. Epidemiology and transmission of cytomegalovirus. J Infect Dis. 1985;152:243–8. - PubMed
    1. Gratama JW, Naipal AM, Oosterveer MA, et al. Effects of herpes virus carrier status on peripheral T lymphocyte subsets. Blood. 1987;70:516–23. - PubMed
    1. Olsson J, Wikby A, Johansson B, Löfgren S, Nilsson B-O, Ferguson F. Age-related change in peripheral blood T-lymphocyte subpopulations and cytomegalovirus infection in the very old: the Swedish longitudinal OCTO immune study. Mech Ageing Dev. 2000;121:187–201. - PubMed
    1. Looney R, Falsey A, Campbell D, et al. Role of cytomegalovirus in the T cell changes seen in elderly individuals. Clin Immunol. 1999;90:213–9. - PubMed
    1. Wikby A, Johansson B, Olsson J, Lofgren S, Nilsson BO, Ferguson F. Expansions of peripheral blood CD8 T-lymphocyte subpopulations and an association with cytomegalovirus seropositivity in the elderly: the Swedish NONA immune study. Exp Gerontol. 2002;37:445–53. - PubMed

Publication types

MeSH terms