. 2008 Mar;76(3):1048-58.
doi: 10.1128/IAI.01383-07. Epub 2008 Jan 14.

Aggregation via the red, dry, and rough morphotype is not a virulence adaptation in Salmonella enterica serovar Typhimurium

Affiliations

Aggregation via the red, dry, and rough morphotype is not a virulence adaptation in Salmonella enterica serovar Typhimurium

A P White et al. Infect Immun. 2008 Mar.

Abstract

The Salmonella rdar (red, dry, and rough) morphotype is an aggregative and resistant physiology that has been linked to survival in nutrient-limited environments. Growth of Salmonella enterica serovar Typhimurium was analyzed in a variety of nutrient-limiting conditions to determine whether aggregation would occur at low cell densities and whether the rdar morphotype was involved in this process. The resulting cultures consisted of two populations of cells, aggregated and nonaggregated, with the aggregated cells preferentially displaying rdar morphotype gene expression. The two groups of cells could be separated based on the principle that aggregated cells were producing greater amounts of thin aggregative fimbriae (Tafi or curli). In addition, the aggregated cells retained some physiological characteristics of the rdar morphotype, such as increased resistance to sodium hypochlorite. Competitive infection experiments in mice showed that nonaggregative DeltaagfA cells outcompeted rdar-positive wild-type cells in all tissues analyzed, indicating that aggregation via the rdar morphotype was not a virulence adaptation in Salmonella enterica serovar Typhimurium. Furthermore, in vivo imaging experiments showed that Tafi genes were not expressed during infection but were expressed once Salmonella was passed out of the mice into the feces. We hypothesize that the primary role of the rdar morphotype is to enhance Salmonella survival outside the host, thereby aiding in transmission.


Figures

FIG. 1.
FIG. 1.
agfB expression versus cell density during growth of S. enterica serovar Typhimurium strain ATCC 14028 in nutrient-limiting conditions. Expression of an agfB promoter-luciferase fusion was measured during growth of strain ATCC 14028 at 28°C in different media. The strain was grown in different media as follows: bar 1, LB without salt (LBns); bar 2, 1/4 LBns; bar 3, 1/10 LBns; bar 4, M9 minimal medium alone; bars 5 to 7, M9 minimal medium supplemented with 0.5% Casamino Acids (bar 5), 0.05% glycerol (bar 6), or 0.05% glucose (bar 7); bar 8, M9 minimal medium without sulfate; bars 9 and 10, minimal medium containing MOPS supplemented with 0.72% glucose (bar 9) or 0.036% glucose (bar 10); bars 11 to 13, minimal medium containing MOPS without bicarbonate (bar 11), nitrogen (bar 12), or phosphate (bar 13); and bar 14, EPS medium (bar 14). Bars correspond to the average maximum optical density measurements during the 48-h growth period; white circles represent the average maximum luminescence values (counts per second [CPS]). Error bars represent the 95% confidence intervals determined from three replicate samples.
FIG. 2.
FIG. 2.
Temporal expression of rdar morphotype genes during growth of strain ATCC 14028 in 1/10 LB without salt at 28°C. Expression of agfD, agfB, adrA, or yihU promoter-luciferase fusions was measured during growth of strain ATCC 14028 in 1/10 LBns (open symbols) or 1/10 LBns supplemented with 40 μM 2,2′-dipyridyl (closed symbols) at 28°C with agitation. Curves represent the average luminescence (counts per second [CPS]) from three biological replicates of each reporter strain as a function of time. Measurements for yihU and adrA are on the right x axis. The broken line represents agfB expression during growth of strain ATCC 14028 in LBns at 28°C with agitation. Inset in upper left represents cell density of cultures (A620) as a function of time.
FIG. 3.
FIG. 3.
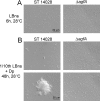
Cell-cell aggregation in strain ATCC 14028 and ΔagfA cultures. S. enterica serovar Typhimurium strain ATCC 14028 (ST 14028) and ΔagfA cultures were analyzed by differential interference contrast microscopy after growth in LBns for 6 h (A) or in 1/10 LBns-Dp for 48 h (B) at 28°C without agitation. Pictures in the top and bottom panels in panel B were taken from the same cultures. A600 values were 0.208 (A) and 0.229 (B) for strain ATCC 14028 cultures and 0.288 (A and B) for ΔagfA cultures. Each picture was magnified 40,000×. Dp, 2,2′-dipyridyl.
FIG. 4.
FIG. 4.
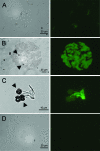
agfB expression in individual cells from different cell fractions of strain ATCC 14028 cultures. Strain ATCC 14028 agfB::gfp reporter strain cultures grown in 1/10 LBns-Dp for 72 h at 28°C were visualized by light microscopy (images on left) and fluorescence microscopy (images on right) either directly (A) or after fractionation with fibronectin-coated magnetic beads (B, C, and D). Representative cells from bead fractions (B and C) and supernatant fractions (D) are shown; arrowheads indicate beads that are bound to cells. Scale bars are shown at bottom right of the light microscopy images.
FIG. 5.
FIG. 5.
Quantification of agfB expression in strain ATCC 14028 cultures fractionated with fibronectin-coated magnetic beads. The ATCC 14028 agfB::lux reporter strain was grown in 1/10 LBns-Dp for 48 to 120 h at 28°C without agitation prior to fractionation with fibronectin-coated magnetic beads (FN-beads). Expression (cps) from cells in unfractionated culture, FN-bead, and supernatant fractions was normalized to the amount of DNA in each sample and is represented as relative light units (RLU). Bars represent the average RLU values ± standard deviations (error bars) from five independent samples measured in triplicate. Statistically significant differences between FN-beads, supernatant, and culture samples are noted by asterisks (**, P < 0.01; *, P < 0.05) as determined by two-way analysis of variance.
FIG. 6.
FIG. 6.
Expression of adrA and agfB in strain ATCC 14028 cell aggregates bound to fibronectin-coated magnetic beads. ATCC 14028 agfB::gfp and adrA::eCherry reporter strains were grown together in 1/10 LBns-Dp for 72 h at 28°C without agitation prior to fractionation with FN-beads and analysis by differential interference contrast microscopy and fluorescence microscopy. (A and B) DICM images of representative cell aggregates with scale bars shown; (C and D) DICM and FM images that have been merged.
FIG. 7.
FIG. 7.
Survival of cells in different strain ATCC 14028 culture fractions following exposure to sodium hypochlorite. Strain ATCC 14028 cells were grown in 1/10 LBns-Dp for 48 h at 28°C without agitation prior to fractionation with FN-beads. Cells in the FN-bead and supernatant fractions were exposed to different levels of sodium hypochlorite for 10 min. Each value represents the average relative survival from at least four samples; the error bars reflect the 95% confidence intervals. Statistically significant differences (P < 0.05) between the FN-bead and supernatant fractions at different hypochlorite concentrations are noted by an asterisk.
FIG. 8.
FIG. 8.
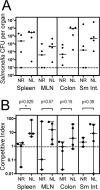
Competitive index infections of ΔagfA strain and strain ATCC 14028 in C57BL/6 mice. Groups of mice were infected with a mixed inoculum of ΔagfA strain and strain ATCC 14028 cells that were grown in nutrient-rich conditions at 37°C (NR) or nutrient-limiting conditions at 28°C (NL). The total numbers of colonizing Salmonella (A) and CI for the ΔagfA strain (B) were determined in the spleen, MLN, colon, and small intestine (Sm Int.). Each data point represents one animal, and horizontal bars indicate means. The broken line in panel A represents the limit of detection (10 CFU), and the broken line in panel B represents a CI value of 1, which would result if there was no competitive difference between the ΔagfA strain and strain ATCC 14028. P values are listed above CI results from each organ, The asterisk represents statistical significance (P < 0.05).
FIG. 9.
FIG. 9.
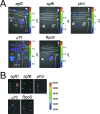
Bioluminescence imaging of Salmonella rdar morphotype gene expression in mice infected by oral gavage. (A) In vivo bioluminescence of the gastrointestinal tracts and organs of C57BL/6 mice following infection with strain ATCC 14028 agfD, agfB, yihU, sig70_16 (σ70), and sig38H4 (RpoS) luciferase reporter strains. Images show the relative signal intensity visualized at a given anatomical location within tissue (small intestine [Sm Int], mesenteric lymph nodes[MLN], spleen [Sp], liver [Li], and colon [Co]). In the color bars displayed on the right of each image, red corresponds to the highest signal intensity and blue corresponds to the lowest signal intensity in units of light measurement (photons/second/cm2/seradian). Representative images are shown from 3 (yihU and RpoS) or 13 (agfD, agfB, and σ70) mice. (B) Bioluminescent images of fecal pellets from mice infected with strain ATCC 14028 reporter strains. Pellets were collected between 60 h and 84 h postinfection. The scale of signal intensity for each image is located on the right.

References

    1. Anriany, Y. A., R. M. Weiner, J. A. Johnson, C. E. De Rezende, and S. W. Joseph. 2001. Salmonella enterica serovar Typhimurium DT104 displays a rugose phenotype. Appl. Environ. Microbiol. 674048-4056. - PMC - PubMed
    1. Arnqvist, A., A. Olsen, J. Pfeifer, D. G. Russell, and S. Normark. 1992. The Crl protein activates cryptic genes for curli formation and fibronectin binding in Escherichia coli HB101. Mol. Microbiol. 62443-2452. - PubMed
    1. Barnhart, M. M., and M. R. Chapman. 2006. Curli biogenesis and function. Annu. Rev. Microbiol. 60131-147. - PMC - PubMed
    1. Ben Nasr, A., A. Olsen, U. Sjobring, W. Muller-Esterl, and L. Bjorck. 1996. Assembly of human contact phase proteins and release of bradykinin at the surface of curli-expressing Escherichia coli. Mol. Microbiol. 20927-935. - PubMed
    1. Bjarnason, J., C. M. Southward, and M. G. Surette. 2003. Genomic profiling of iron-responsive genes in Salmonella enterica serovar Typhimurium by high-throughput screening of a random promoter library. J. Bacteriol. 1854973-4982. - PMC - PubMed

Publication types

MeSH terms

LinkOut - more resources