. 2008 Jan 14;180(1):159-72.
doi: 10.1083/jcb.200707136.

A syntaxin 10-SNARE complex distinguishes two distinct transport routes from endosomes to the trans-Golgi in human cells

Affiliations

A syntaxin 10-SNARE complex distinguishes two distinct transport routes from endosomes to the trans-Golgi in human cells

Ian G Ganley et al. J Cell Biol. .

Abstract

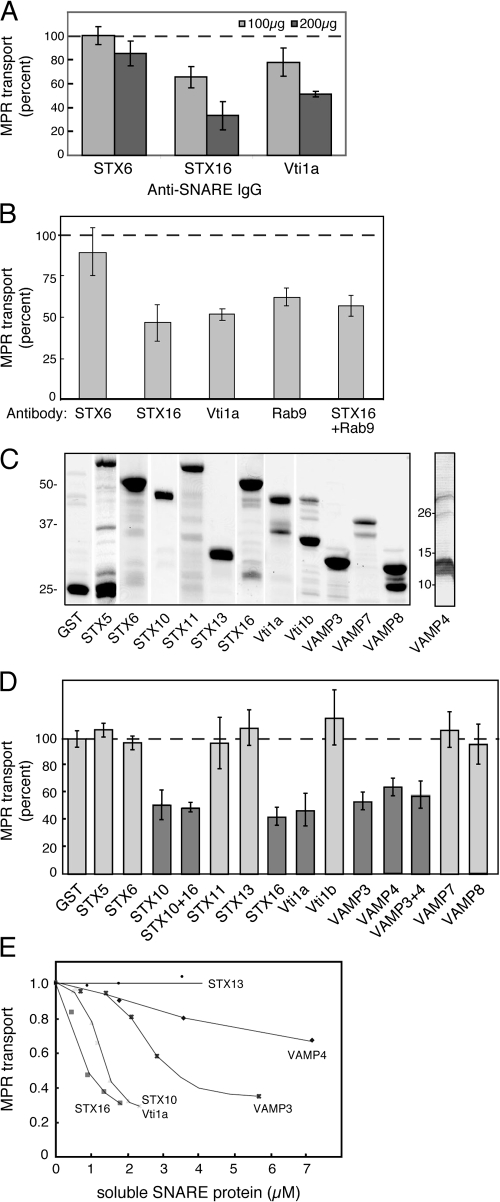
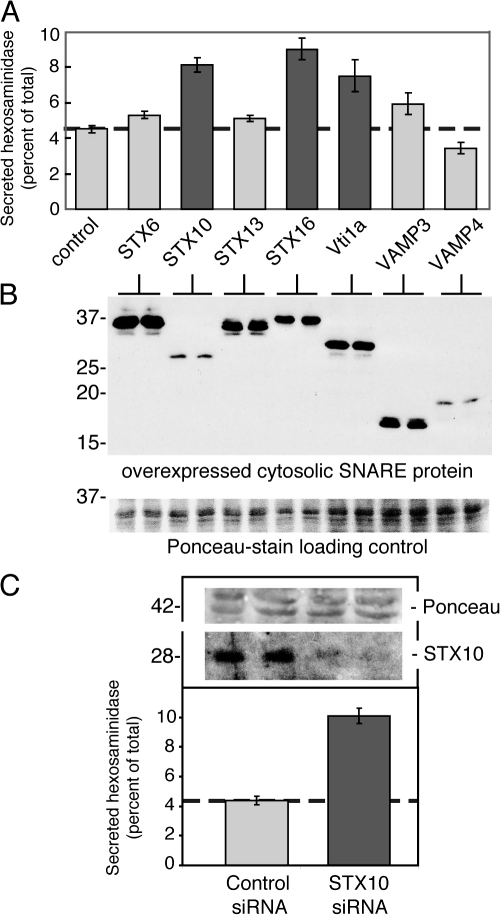
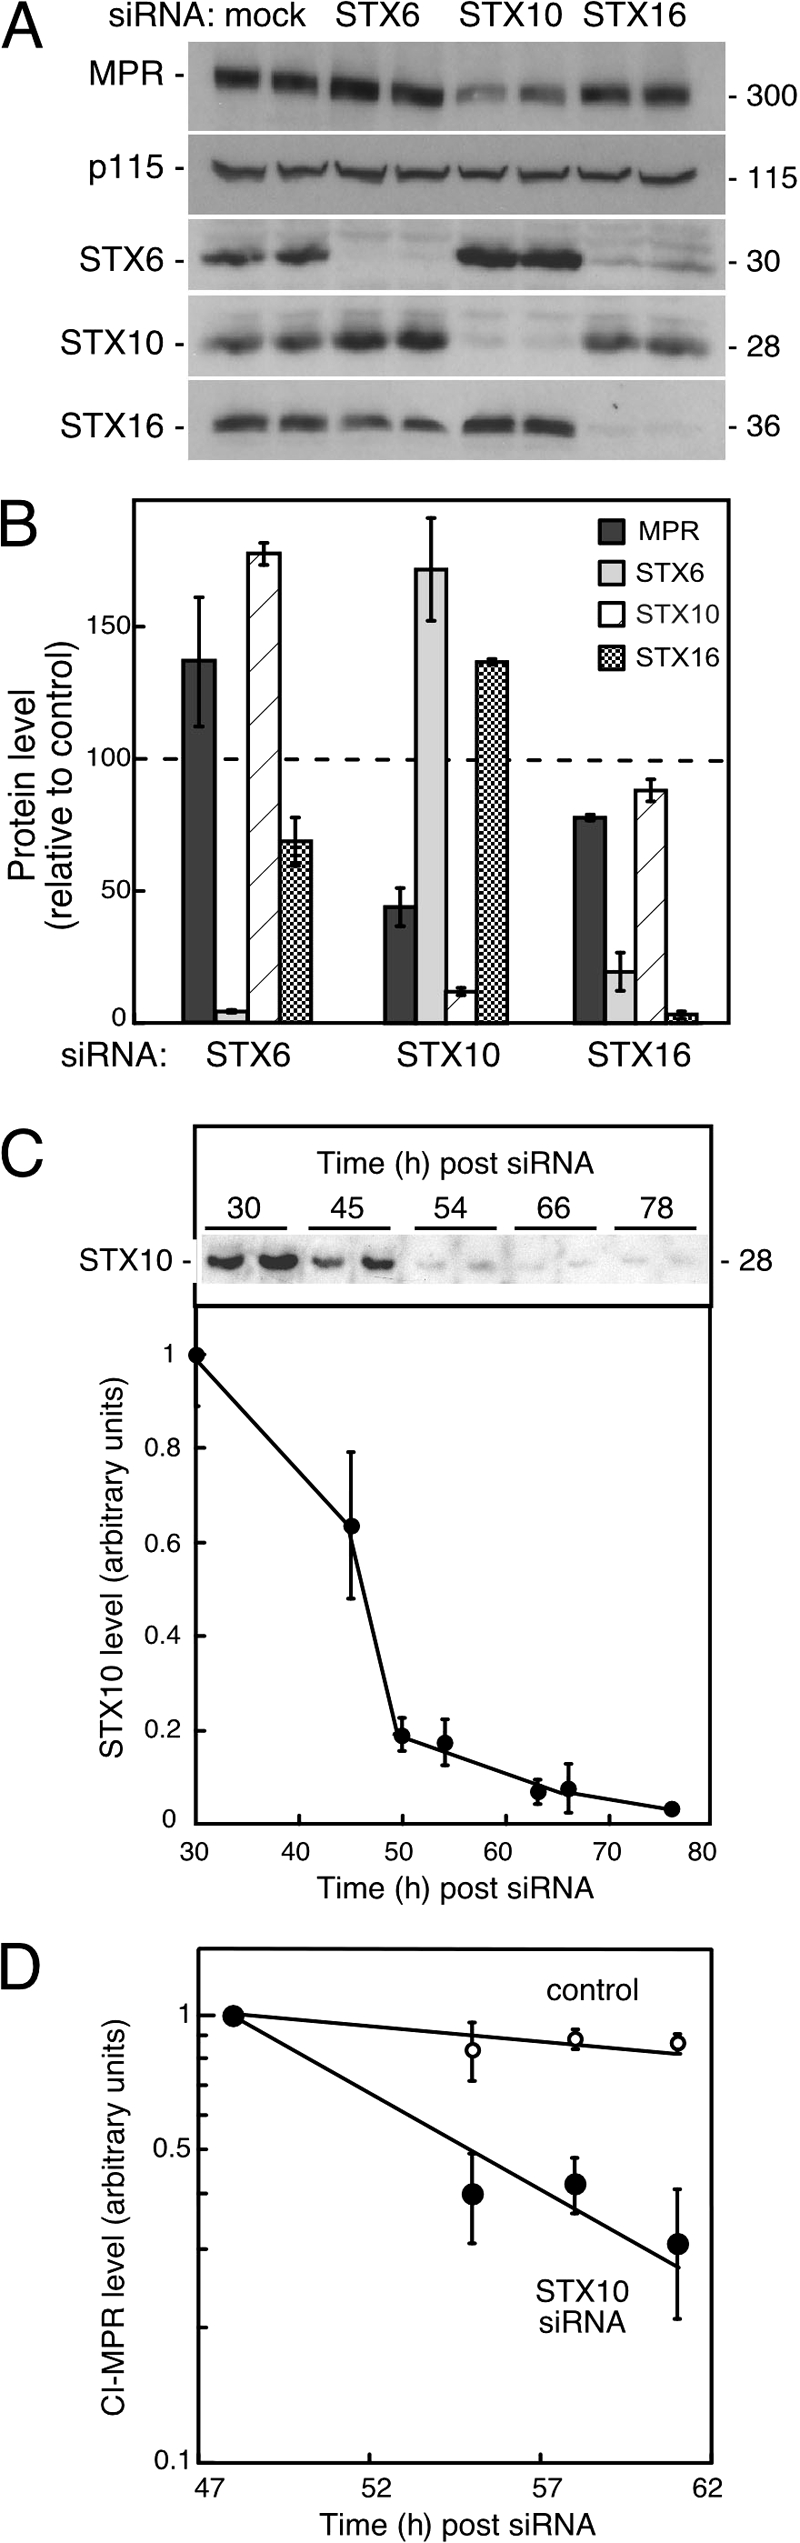
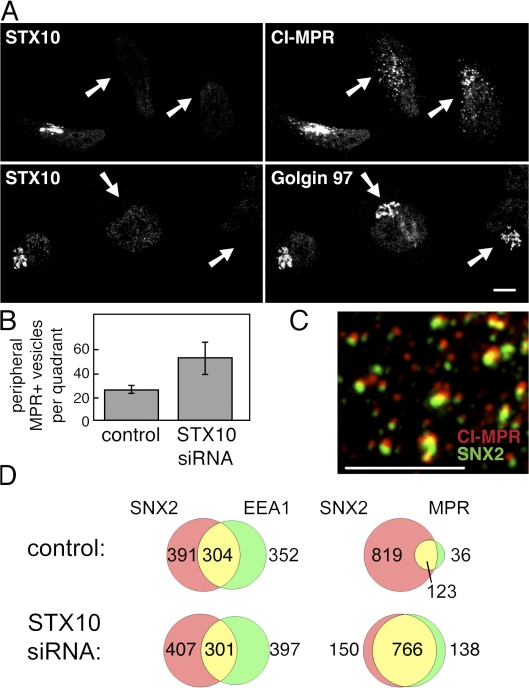
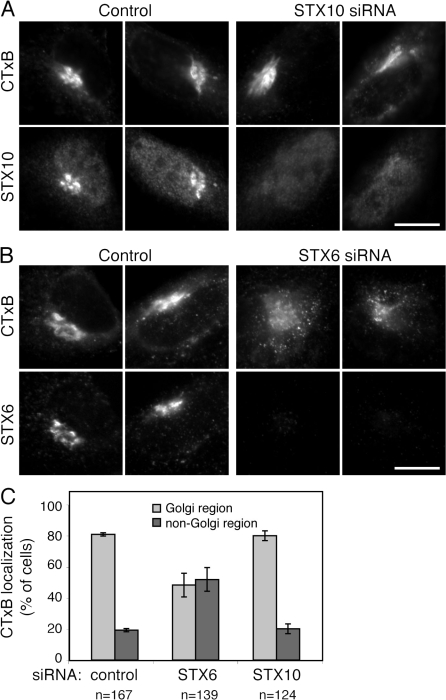
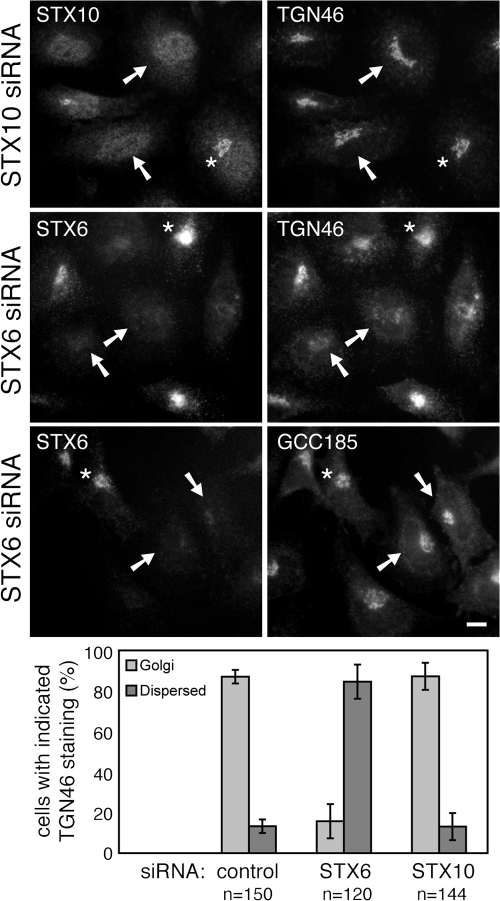
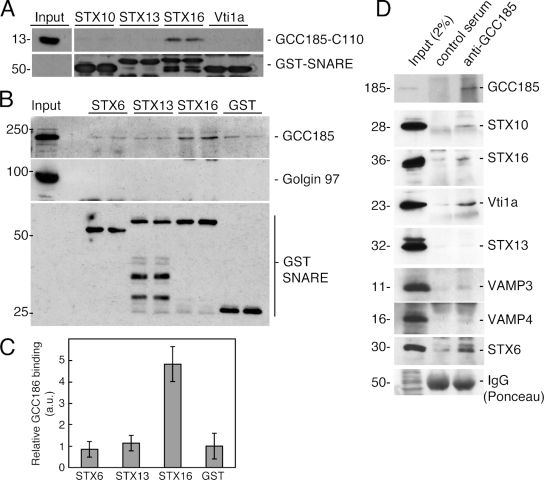
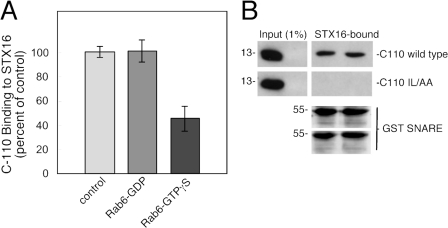
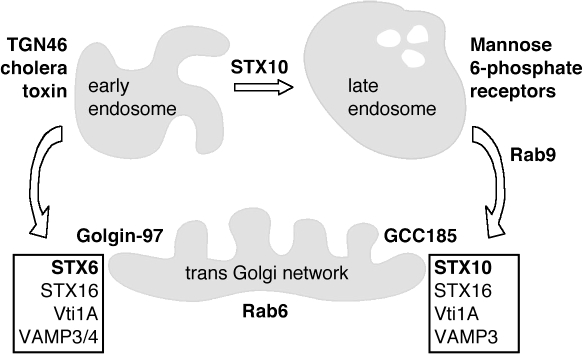
Mannose 6-phosphate receptors (MPRs) are transported from endosomes to the Golgi after delivering lysosomal enzymes to the endocytic pathway. This process requires Rab9 guanosine triphosphatase (GTPase) and the putative tether GCC185. We show in human cells that a soluble NSF attachment protein receptor (SNARE) complex comprised of syntaxin 10 (STX10), STX16, Vti1a, and VAMP3 is required for this MPR transport but not for the STX6-dependent transport of TGN46 or cholera toxin from early endosomes to the Golgi. Depletion of STX10 leads to MPR missorting and hypersecretion of hexosaminidase. Mouse and rat cells lack STX10 and, thus, must use a different target membrane SNARE for this process. GCC185 binds directly to STX16 and is competed by Rab6. These data support a model in which the GCC185 tether helps Rab9-bearing transport vesicles deliver their cargo to the trans-Golgi and suggest that Rab GTPases can regulate SNARE-tether interactions. Importantly, our data provide a clear molecular distinction between the transport of MPRs and TGN46 to the trans-Golgi.


Figures

Figure 1.
Figure 1.
Retrograde transport of MPRs to the TGN is mediated by STX10, STX16, Vti1a, and VAMP3. (A) In vitro transport of CD-MPRs in reactions containing 100 μg/ml (light gray bars) or 200 μg/ml (dark GRAY bars) anti-SNARE IgG. Cytosol-dependent transport is expressed as a percentage of the control reaction containing the equivalent amount of nonspecific IgG. Error bars represent SD; data are from three independent experiments. (B) In vitro transport of MPRs in reactions containing 200 μg/ml of the indicated IgG. (C) Coomassie-stained SDS-PAGE of recombinant SNAREs used in D. Each lane contains 15 μg of purified protein except the lanes for STX10 and Vti1b, which contain 10 μg of purified protein. (D) In vitro transport of MPRs in reactions containing 100 μg/ml GST alone (3.8 μM), GST-tagged versions of soluble STX5 (1.8 μM), STX6 (1.9 μM), STX10 (2 μM), STX11 (1.8 μM), STX16 (1.9 μM), Vti1a (2.3 μM), Vti1b (2.3 μM), VAMP3 (2.8 μM), VAMP7 (2.7 μM), VAMP8 (2.6 μM), or thrombin-cleaved soluble domains of STX13 (3.5 μM) and VAMP4 (7.1 μM). (B and D) Error bars represent SD from at least two independent experiments performed in triplicate. The dashed line demarcates 100%. (E) In vitro transport of MPRs in reactions containing the indicated amounts of GST-soluble SNARE protein. Values are means from at least two independent experiments performed in triplicate.
Figure 2.
Figure 2.
Hexosaminidase secretion is increased in cells when STX10, STX16, or Vti1a function is compromised. (A) HeLa cells grown in 6-cm dishes were either mock transfected (control) or transfected with the indicated myc-tagged cytosolic SNARE and incubated in fresh media for 8 hto collect secreted hexosaminidase. (B) Immunoblot of overexpressed SNARE proteins from the cells analyzed in A and a portion of the Ponceau S–stained filter as a loading reference. Proteins were detected with anti-myc tag antibody. (C) Hexosaminidase secretion from control or STX10-depleted HeLa cells. The top panel shows a Ponceau S–stained immunoblot membrane (top bar) of HeLa cell lysate reacted with antibodies to monitor STX10 depletion. Numbers at the right in B and C indicate M r in kilodaltons. (A and C) Values are means from at least three independent experiments performed in triplicate; error bars represent SD.
Figure 3.
Figure 3.
MPRs are destabilized in cells depleted of STX10. CI-MPR and SNARE protein levels in HEK293 cells transfected with the indicated siRNAs. (A) Immunoblot. (B) Quantitation of the data shown in A. Values are from two independent experiments, normalized to p115 levels relative to protein levels in control transfected cells. Error bars represent SD. (C) Kinetics of STX10 depletion after siRNA transfection of HEK293 cells. The inset shows an immunoblot of STX10 monitored at the indicated times. Quantitation of those data is graphed; two independent experiments performed in duplicate are presented. (D) Half-life of CI-MPRs in cells depleted of STX10 measured at the times indicated after siRNA transfection. Numbers at the right in A and C indicate M r in kilodaltons.
Figure 4.
Figure 4.
Depletion of STX10 leads to CI-MPR dispersal to sorting nexin-2–positive structures but does not disrupt Golgin 97 localization. (A) Summation of confocal z sections of HeLa cells treated with STX10 siRNA and double labeled with rabbit anti-STX10 and mouse anti–CI-MPR (top) or rabbit anti-STX10 and mouse anti–Golgin 97 (bottom). Arrows point to cells depleted of STX10. Bar, 10 μm. (B) Quantitation of CI-MPR dispersal in cells depleted of STX10. Peripheral CI-MPR–positive vesicles were determined as described in Materials and methods. The mean number of vesicles from three separate cells normalized for cell area is shown. Error bars represent SD. (C) Deconvolution microscope image showing colocalization of endogenous CI-MPR (stained red with mouse antibody) and sorting nexin-2 (stained green with rabbit antibody) in the periphery of a HeLa cell depleted of STX10. Bar, 5 μm. (D) Venn diagrams representing the quantitation of colocalization between sorting nexin-2 and EEA1 or sorting nexin-2 and CI-MPR in nonperinuclear regions of control and STX10-depleted HeLa cells. Vesicles were from nine (control) or seven (STX10 depleted) separate cells from two independent experiments. Venn diagrams are correctly scaled for percentage overlap to permit the direct comparison of antigens in each vesicle population.
Figure 5.
Figure 5.
Cholera toxin B fragment transport in cells depleted of STX10 or 6. (A) HeLa cells were treated with control siRNA (left) or STX10 siRNA (right) and were allowed to internalize AlexaFluor488-conjugated cholera toxin B (CTxB) for 30 min followed by a 30-min chase. Cholera toxin B or rabbit anti-STX10 staining (detected with AlexaFluor 94 anti–rabbit) is indicated at the left. (B) Control (left) and STX6-depleted (right) HeLa cells were treated with cholera toxin B as in A. Cholera toxin B and mouse anti-STX6 staining (detected with AlexaFluor594 anti–mouse) of the same cells is indicated at the left. (C) Quantitation of the data shown in A and B. The numbers of cells counted (n) were from three independent experiments, and error bars represent SD. Bars, 10 μm.
Figure 6.
Figure 6.
TGN46 transport in cells depleted of STX10 or S6. HeLa cells were treated with STX10 siRNA (top) or STX6 siRNA (middle) and were stained for the indicated proteins; TGN46 was detected with sheep antibody and AlexaFluor594 anti–sheep antibodies. Arrows point to SNARE-depleted cells, and asterisks mark undepleted cells. The bottom panel presents quantitation of the data shown. The numbers of cells counted (n) were from two independent experiments; error bars represent SD. Bar, 10 μm.
Figure 7.
Figure 7.
STX16 interacts directly and specifically with GCC185. (A) GST-tagged cytosolic SNAREs were incubated with purified GCC185–C-110. Tagged SNAREs were recovered by glutathione–Sepharose beads, and the bound proteins were analyzed by SDS-PAGE and immunoblotting with rabbit anti-GCC185 (top) to detect bound C-110 or with rabbit anti-GST (bottom) to detect input SNAREs. Input lane at the left (top row) represents 2% of the total GCC185–C-110 used in each reaction. (B) STX16 interacts with full-length GCC185. Recombinant GST-tagged soluble SNARE proteins were incubated with K562 cell cytosol; the tagged SNAREs were then retrieved with glutathione–Sepharose beads. Bound proteins were analyzed by SDS-PAGE and immunoblotting to detect bound, full-length GCC185 (top), full-length Golgin97 (middle), or resin-bound GST-SNARE proteins (bottom). The input lane represents 1% of the total cytosol used in each reaction. (C) Quantitation of the data shown in B. Error bars represent SD from two independent experiments. (D) STX10, STX16, and Vti1a coimmunoprecipitate with GCC185. HeLa cells expressing the myc-tagged soluble SNAREs were lysed and incubated with equal amounts of either control serum or anti-GCC185 serum. Immune complexes were isolated with protein A–agarose, and bound proteins were analyzed by SDS-PAGE and immunoblotting with either rabbit anti-GCC185 serum (top) or mouse anti-myc antibody to detect exogenous SNARE proteins. A Ponceau S–stained region of the gel is shown as a loading control for IgG at the bottom. Numbers next to the gels in A, B, and D indicate M r in kilodaltons.
Figure 8.
Figure 8.
Rab6 competes with STX16 for GCC185 binding. (A) Purified, GCC185–C-110 and GST-soluble STX16 were incubated together, either alone or with Rab6 preloaded with GDP or GTPγS. GST-STX16 was recoveredwith glutathione–Sepharose beads; the bound GCC185–C-110 was analyzed by SDS-PAGE, and the immunoblot was probed with anti-GCC185 antibody. Immunoblots were quantified; the amount of GCC185–C-110 binding to STX16 relative to binding in the absence ofRab protein (control) from two independent experiments is shown. Error bars represent SD. (B) Equal amounts of purified GCC185–C-110 wild type or GCC185–C-110 IL/AA were incubated with GST-tagged soluble STX16. GST-STX16 was recovered with glutathione–Sepharose beads, and the bound proteins were analyzed by SDS-PAGE and immunoblotting with rabbit anti-GCC185 (top) to detect C-110or with rabbit anti-GST (bottom) to detect STX16. Numbers at the left indicate M r in kilodaltons.
Figure 9.
Figure 9.
Summary diagram showing the distinct molecular requirements for transport from late endosomes and early endosomes to the TGN. See Discussion for details. A role for STX6 in cholera toxin transport is shown here. A role for STX6, Vti1a, and STX16 in Shiga toxin transport was shown by Mallard et al. (2002), and a role for STX16 was shown by Wang et al. (2005). STX16 has also been shown to participate in cholera toxin recycling (Amessou et al., 2007). Therefore, we assume that cholera and Shiga toxins are using the same STX6 complex.

References

    1. Aivazian, D., R.L. Serrano, and S. Pfeffer. 2006. TIP47 is a key effector for Rab9 localization. J. Cell Biol. 173:917–926. - PMC - PubMed
    1. Amessou, M., A. Fradagrada, T. Falguieres, J.M. Lord, D.C. Smith, L.M. Roberts, C. Lamaze, and L. Johannes. 2007. Syntaxin 16 and syntaxin 5 are required for efficient retrograde transport of several exogenous and endogenous cargo proteins. J. Cell Sci. 120:1457–1468. - PMC - PubMed
    1. Antonin, W., C. Holroyd, D. Fasshauer, S. Pabst, G.F. Von Mollard, and R. Jahn. 2000. a. A SNARE complex mediating fusion of late endosomes defines conserved properties of SNARE structure and function. EMBO J. 19:6453–6464. - PMC - PubMed
    1. Antonin, W., C. Holroyd, R. Tikkanen, S. Honing, and R. Jahn. 2000. b. The R-SNARE endobrevin/VAMP-8 mediates homotypic fusion of early endosomes and late endosomes. Mol. Biol. Cell. 11:3289–3298. - PMC - PubMed
    1. Arighi, C.N., L.M. Hartnell, R.C. Aguilar, C.R. Haft, and J.S. Bonifacino. 2004. Role of the mammalian Retromer in sorting of the cation-independent mannose 6-phosphate receptor. J. Cell Biol. 165:123–133. - PMC - PubMed

Publication types

MeSH terms