. 2008 Jan 15;178(2):105-120.
doi: 10.1016/j.cpc.2007.08.012.

A new adaptive grid-size algorithm for the simulation of sedimentation velocity profiles in analytical ultracentrifugation

Affiliations

A new adaptive grid-size algorithm for the simulation of sedimentation velocity profiles in analytical ultracentrifugation

Patrick H Brown et al. Comput Phys Commun. .

Abstract

Analytical ultracentrifugation allows one to measure in real-time the concentration gradients arising from the application of a centrifugal force to macromolecular mixtures in solution. In the last decade, the ability to efficiently solve the partial differential equation governing the ultracentrifugal sedimentation and diffusion process, the Lamm equation, has spawned significant progress in the application of sedimentation velocity analytical ultracentrifugation for the study of biological macromolecules, for example, the characterization of protein oligomeric states and the study of reversible multi-protein complexes in solution. The present work describes a numerical algorithm that can provide an improvement in accuracy or efficiency over existing algorithms by more than one order of magnitude, and thereby greatly facilitate the practical application of sedimentation velocity analysis, in particular, for the study of multi-component macromolecular mixtures. It is implemented in the public domain software SEDFIT for the analysis of experimental data.


Figures

Figure 1
Figure 1
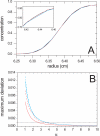
Example for the shape of sedimentation velocity profiles of large macromolecules. The curves shown are calculated for a large protein complex (1 MDa and 30 S) at unit concentration sedimenting at 50,000 rpm. Steep slopes can be discerned in the sedimentation boundary, in particular, at early times close to the meniscus at 6.2 cm (1), and close to the distal end (bottom) of the solution column (2). The latter steep increase close to the end of the solution column is referred to as back-diffusion region. It cannot be experimentally reliably imaged, and is therefore customarily excluded from the data analysis (but until recently not from the computed LE solutions). The inset shows the increase in concentration with time at the end of the solution column (3), reaching concentrations > 100-fold the loading concentration, in the experiment frequently leading to phase transitions and surface film formation. This back-diffusion region can be excluded from the LE solution by using the boundary conditions for a semi-infinite column (or permeable bottom). Except for very early and very late time-points, the boundary enclosed by regions of the solvent plateau (4) and solution plateau (5). The concentration in the solvent plateau is negligible (for example, < 10−30 from 6.2 to 6.3 cm at times > 600 sec), and in good approximation is constant at zero. The concentration in the solution plateau is also virtually constant, but decreasing with time due to the effect of radial dilution in the sector-shaped solution column (see Eq. 4). Also shown are examples for the location of the fitting limits r1* and r2* that exclude the regions of experimental optical artifacts and describe the radial range of reliable data acquisition.
Figure 2
Figure 2
Spatial distribution of the radial grid and the evolution of active and inactive grid points. The grid is taken from the example discussed in Figure 7, where N = 100 points are used to describe sedimentation of a 10 S, 450 kDa protein in a solution column from 6.5 to 7.2 cm. For the data analysis limits at 6.51 cm and 7.165 cm (blue dashed lines), Eq. 12 results in grid points indicated by the vertical lines. Dependent on the position of the sedimentation boundary, grid points that are active (differing by more than 10−4 from both solvent and solution plateaus) are shown in red. The inactive grid points, shown in black, do not require numerical computation. The evolution of the concentration profile is indicated by the vertical axis, which denotes the iteration steps (A) or time (B and C), respectively. The division of active and inactive is dynamically adjusted (bold red lines), leaving less than half of the points active throughout the simulation. In Panels B and C, the dotted line indicates the boundary midpoint. Panel C provides an expanded view for early times and radii close to the meniscus. It should be noted that the grid spacing between 6.5 cm and 6.51 cm is constant at Δr0 (Eq. 12b), before increasing in a manner following diffusional broadening (Eq. 12a).
Figure 3
Figure 3
Theoretical deviation of a segmented piece-wise linear approximation to a smooth sedimentation boundary. (A) As a reference boundary, the concentration profile of a 100 kDa, 6 S – species sedimenting for 1770 sec at a rotor speed of 50,000 rpm was computed with a very fine grid (black line). Assuming a constant distance between neighboring grid points given by the expression σ (Eq. 9) (which corresponds to value of α = 1, or approximately 6 points available to describe the transition from solvent to solution plateau), the best possible boundary approximation with piece-wise linear segments is shown as red dotted line (optimizing the concentration values at each grid point to minimize the largest vertical deviation). The maximum deviation at the most favorable lateral offset of the grid relative to the boundary is termed δ0 (Eq. 10), and represents the obligate error, a lower limit that any numerical LE solution will have to exceed. The blue line shows the segmented boundary representation when the concentration values at the grid points are constrained to the true values at these grid points. This deviation is δ1 or δ2 (Eq. 11), and is larger than δ0. The inset shows an expanded view of the leading edge of the boundary. (B) The deviations from the smooth boundary change as a function of grid interval, plotted in units of α. Shown are the maximum deviations when the concentration values at the grid points are held at the ‘true’ value of the smooth curve, for the best and worst possible relative position of grid and boundary midpoint (δ2 and δ1, blue solid and dotted lines), respectively. The obligate error δ0, when the concentration values are not held to the smooth curve, is shown as red solid line. For comparison, also shown is this error at the worst possible relative position of grid to boundary midpoint (dotted red line).
Figure 4
Figure 4
(A) Concentration profiles calculated for a 100 kDa protein with a sedimentation coefficient of 6 S sedimenting at ω = 50,000 rpm in a 10 mm solution column (m = 6.2 cm, b = 7.2 cm). Under these conditions, back-diffusion does not extend into the data range shown. In order to serve as a reference solution, the LE was solved on a fine grid with N = 10,000 using the standard Claverie algorithm without consideration of rotor acceleration. The time-intervals between the boundaries shown are 300 sec, mimicking experimental data acquisition of scans at discrete times. For clarity, the concentration profiles at selected times are highlighted: 300 sec (red), 600 sec (blue), 4500 sec (cyan), and 7800 sec (green). (B) Difference to the reference solution when the LE solution is calculated on a coarse grid with N = 100, using the standard Claverie algorithm. The maximum deviation of ∼ 0.0085 occurs for the first ‘scan’ (red line), the boundary with the highest slope. For comparison, the bold black lines show the theoretical deviations from the representation of the boundaries as piece-wise linear segments, requiring the concentrations at the grid points to be identical to the true solution (δ2 in Eq. 11, dotted line), or to be freely optimized (δ0 in Eq. 10, dashed line). (C) On the same scale, the difference to the reference solution when the LE solution is calculated with the new algorithm using the placement of grid-points according to Eq. 12, at the same total number of initial grid points N = 100. (With α = 3.63, this resolution does not quite at the more conservative goal of α = 5, which would require N = 137 points and have a maximum deviation of 0.00065.) The dynamic reduction of grid points in the solvent plateau leads to the use of only 31 grid points at the time of the latest scan shown.
Figure 5
Figure 5
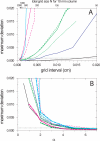
Errors of numerical LE solution for different sedimentation parameters and grids. (A) Maximum deviation as a function of grid interval, or total grid size N for a 10 mm column, respectively. Shown are simulations based on the Claverie algorithm with equidistant grid (solid lines) and/or moving hat algorithm with logarithmically spaced grid following Eq. 8 (dashed lines) for particles with: 1 kDa, 0.3 S, 50,000 rpm (black); 10 kDa, 1.5 S, 50,000 rpm (blue); 100 kDa, 6S, 50,000 rpm (green), 450 kDa, 10 S, 60,000 rpm (magenta), and 1 MDa, 30 S, 50,000 rpm (cyan). The simulated sedimentation included a rotor acceleration phase with dω/dt = 200 rpm/sec, except for one comparison with the 100 kDa species indicated as thin green dotted line, which did not include rotor acceleration. In all calculations, a LE solution was calculated as a reference, with the same parameters on a very fine grid with N = 10,000. The maximum deviation from coarse-grid simulation was observed in the radial range excluding the 0.01 cm closest to the meniscus, and excluding the back-diffusion region (except for the smallest species). The benchmark of the desired maximum error of 0.001 is indicated as black dotted line. (B) The same data plotted as a function of α, the ratio between minimum boundary width σ and grid interval. σ was determined as described in Eq. 9. The colors and linetypes are unchanged. Additionally, the bold dash-dotted lines are the maximum deviations observed using the new algorithm with optimized non-equidistant grid Eq. 12.
Figure 6
Figure 6
Accuracy of simulated sedimentation obtained with Cao & Demeler's ASTFEM method for a model system of a particle with s = 10 S, D = 2×10⁻⁷ cm2/sec (corresponding, for example, to an elongated 450 kDa protein with f/f0 ∼ 2.0) sedimenting at 60,000 rpm in a 7 mm solution column from 6.5 cm to 7.2 cm. This is Figure 8B from Cao & Demeler [43], reproduced with permission. It shows the boundary approximations with the ASTFEM method at different grid size values N for the same sedimentation parameters. The red line is the simulated boundary at a value of N = 100. For comparison, the calculated sedimentation boundaries with the same parameters using the new non-equidistant static grid finite element algorithm are shown in Figure 6B.
Figure 7
Figure 7
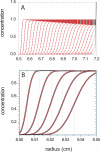
Sedimentation profiles calculated for the same parameters as in Figure 6. (A) Reference concentration profiles were computed with a very fine grid (N = 10,000) , shown in time-intervals of 100 sec (black line). The concentration scale is truncated, and reaches values > 900 at the bottom, but quickly decays with increasing distance from the bottom, e.g. 1000-fold within 0.01 cm of the bottom. Also shown as dashed red line is the LE solution with the new non-equidistant, static grid algorithm with N = 100 (corresponding to α = 1.7) eliminating back-diffusion by placing the left and right analysis limits r1* and r2* at 6.51 cm and 7.165 cm, respectively. Over this radial range, the maximum error to the data shown is 0.0043. The dynamic reduction of grid points in the solvent plateau leads to the use of only 20 points at the time of the last scan shown. (B) Focusing on selected early time-points, this plot is showing the ‘true’ boundary (bold black line) and the same LE solution at N = 100 and N = 200 with the non-equidistant grid (red line and thin white line within the red, respectively). The segmentation of even the red N = 100 line cannot be easily discerned visually (e.g. from the uneven thickness of the black rim in the leading shoulders caused by the piece-wise linear red line within the black, and by the red rim caused by the thin white N = 200 line within the red line). Nevertheless, as expected, for N = 100 at α = 1.7 the discretization is not yet regarded sufficient as judged by the maximum deviation of 0.0043 between r1* and r2*. The standard accuracy of 0.001 for modeling experimental data requires approximately N = 300 grid points. The errors at N = 100 are approximately 20fold smaller at r1* than those seen in Figure 6 at the same grid size with Cao & Demeler's ASTFEM method. The difference is due to the placement of the highest density of the radial grid points in the latter method close to the bottom to stabilize computation of the back-diffusion region, whereas in the generalized Claverie method with non-equidistant grid the highest density is found where the steepest sedimentation boundaries occur. For comparison, the step-functions Eq. 4 are shown as gray lines. These have a maximum deviation of 0.49, but an rmsd of only 0.041.

Similar articles

Cited by

References

    1. Svedberg T, Pedersen KO. The ultracentrifuge. Oxford University Press; London: 1940.
    1. Svedberg T, Fahraeus R. A new method for the determination of the molecular weight of the proteins. J Am Chem Soc. 1926;48:320–438.
    1. Schachman HK. Ultracentrifugation in Biochemistry. Academic Press; New York: 1959.
    1. Signer R, Gross H. Ultrazentrifugale Polydispersitätsbestimmungen an hochpolymeren Stoffen. Helv. Chim. Acta. 1934;17:726.
    1. Meselson M, Stahl FW. The replication of DNA in Escherichia coli. Proc. Natl. Acad. Sci. U S A. 1958;44:671. - PMC - PubMed

LinkOut - more resources