. 2008 Sep;22(9):693-705.
doi: 10.1007/s10822-007-9159-2. Epub 2008 Jan 15.

An improved relaxed complex scheme for receptor flexibility in computer-aided drug design

Affiliations

An improved relaxed complex scheme for receptor flexibility in computer-aided drug design

Rommie E Amaro et al. J Comput Aided Mol Des. 2008 Sep.

Abstract

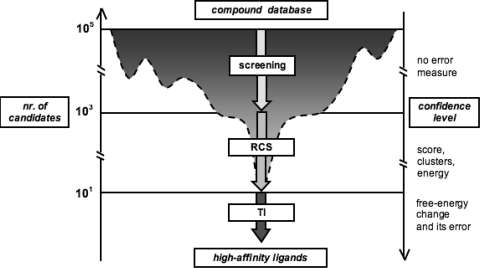
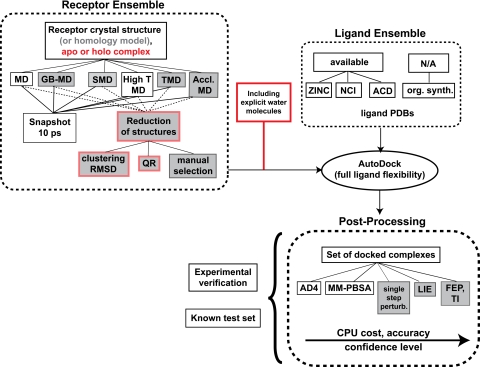
The interactions among associating (macro)molecules are dynamic, which adds to the complexity of molecular recognition. While ligand flexibility is well accounted for in computational drug design, the effective inclusion of receptor flexibility remains an important challenge. The relaxed complex scheme (RCS) is a promising computational methodology that combines the advantages of docking algorithms with dynamic structural information provided by molecular dynamics (MD) simulations, therefore explicitly accounting for the flexibility of both the receptor and the docked ligands. Here, we briefly review the RCS and discuss new extensions and improvements of this methodology in the context of ligand binding to two example targets: kinetoplastid RNA editing ligase 1 and the W191G cavity mutant of cytochrome c peroxidase. The RCS improvements include its extension to virtual screening, more rigorous characterization of local and global binding effects, and methods to improve its computational efficiency by reducing the receptor ensemble to a representative set of configurations. The choice of receptor ensemble, its influence on the predictive power of RCS, and the current limitations for an accurate treatment of the solvent contributions are also briefly discussed. Finally, we outline potential methodological improvements that we anticipate will assist future development.


Figures

Fig. 1
Fig. 1
The problem: how to distill a few good binders and characterize their binding propensity out of a vast database of compounds
Fig. 2
Fig. 2
An overview of the RCS. Improvements to the RCS are shown in gray background and those specifically presented in this paper are outlined in red. In the “Receptor Ensemble” box (top left), the structures can be generated with classical MD, or a variety of simulation techniques could be considered in order to enhance the sampling of the receptor configurational space, including: Generalized-Born MD (GB-MD), steered MD (SMD), high temperature MD (High T MD), targeted MD (TMD), and accelerated MD (Accl. MD). In the “Ligand Ensemble” box (top right), commercially or publicly available ligands can be found in the Zinc Is Not Commercial (ZINC), National Cancer Institute (NCI), and Available Chemicals Database (ACD), among others. AutoDock is then used to dock the ligand database into the receptor ensemble. In the “Post-Processing” stage, the docked complexes can be rescored or reevaluated using more rigorous protocols than the AutoDock version 4.0 scoring function (AD4), including molecular-mechanics Poisson–Boltzmann surface area (MM-PBSA), single step perturbation, LIE, and FEP or TI techniques
Fig. 3
Fig. 3
(a) The W191G cavity mutant of cytochrome c peroxidase and its two dominant configurations extracted using an RMSD conformational clustering analysis for the gating-loop and MD simulations of the separate states. The closed (blue) and open (yellow) gate states are highlighted, together with Asp 235, the residue determining the orientation of the binders in the cavity. The heme cofactor is shown in red. (b) Binding propensities of the best binder (2a5mt) and of the binder suggested to induce the full opening of the gating loop (bzi) are shown [69]. For each of the two conformational states of the gating loop the probability distributions of the binding affinities from RCS calculations are shown as based on the apo (black), holo (red), and apo open-gate (green) receptor ensemble simulations. The dashed-vertical lines correspond to the experimental free energies of binding. Docking poses for 2a5mt (c) and bzi (d) are displayed from corresponding crystal structures (yellow) and the RCS calculations based on MD simulations of the apo (black), holo (red), and apo open-gate (green) receptors
Fig. 4
Fig. 4
Reducing redundancy in the receptor ensemble. (a) Left panel: Multidimensional QR factorization of KREL1 determines the distance relationship among all pairs of proteins (according to RMSD) and then reorders them based on increasing linear dependence, allowing the distillation of a reduced, representative set of structures for docking. At any particular QH threshold (indicated by red dotted line at QH 0.86), at each point of intersection of a branch, the most linearly independent structure is chosen from the group to the right of the dotted line (each red open circle drawn at the branch intersection indicates the choice of one structure to represent all structures to the right of the node). For clarity, the structure tree shown here is reduced (not all KREL1 structures are shown). Right panel: the initial (top) set of structures with the corresponding binding spectrum and the reduced set (bottom) is shown. The similarity between the full and reduced binding spectrums indicates that there is virtually no loss of information. (b) Dominant configurations of the W191G cavity region as extracted from RMSD conformational clustering. For each separate MD ensemble the corresponding reference crystal configuration is displayed (red thin lines) superimposed on the central member structures of the first (yellow licorice) and second (green licorice) most populated clusters.
Fig. 5
Fig. 5
Solvent contributions in protein–ligand binding. (a) The KREL1 active site with one of the newly discovered inhibitors in a predicted docked conformation. KREL1 is shown in orange cartoon, with the novel inhibitor shown docked in the active site (licorice, atom type colors). The three crystallographic water sites (not included in the docking calculation) are shown in licorice with their van der Waals surface in transparent. Note that the sulfonic acid group of the inhibitor replaces the location of a crystal water molecule. (b) For the W191G cavity (gray surface), the crystallographic water sites (solid red spheres; diameter corresponding to X-ray resolution) are compared to the highly favorable average density regions of water molecules in the MD simulations (blue wireframe isosurfaces), for the best binder 2a5mt (yellow licorice) and from the 1AEN crystal structure (red licorice)

References

    1. {'text': '', 'ref_index': 1, 'ids': [{'type': 'DOI', 'value': '10.1016/S1367-5931(02)00341-1', 'is_inner': False, 'url': 'https://doi.org/10.1016/s1367-5931(02)00341-1'}, {'type': 'PubMed', 'value': '12133719', 'is_inner': True, 'url': 'https://pubmed.ncbi.nlm.nih.gov/12133719/'}]}
    2. Carlson HA (2002) Curr Opin Chem Biol 6:447 - PubMed
    1. {'text': '', 'ref_index': 1, 'ids': [{'type': 'DOI', 'value': '10.1146/annurev.pharmtox.43.100901.140216', 'is_inner': False, 'url': 'https://doi.org/10.1146/annurev.pharmtox.43.100901.140216'}, {'type': 'PubMed', 'value': '12142469', 'is_inner': True, 'url': 'https://pubmed.ncbi.nlm.nih.gov/12142469/'}]}
    2. Wong CF, McCammon JA (2003) Annu Rev Pharmacol Toxicol 43:31 - PubMed
    1. {'text': '', 'ref_index': 1, 'ids': [{'type': 'DOI', 'value': '10.1002/(SICI)1521-3773(19990315)38:6<736::AID-ANIE736>3.0.CO;2-R', 'is_inner': False, 'url': 'https://doi.org/10.1002/(sici)1521-3773(19990315)38:6<736::aid-anie736>3.0.co;2-r'}, {'type': 'PubMed', 'value': '29711793', 'is_inner': True, 'url': 'https://pubmed.ncbi.nlm.nih.gov/29711793/'}]}
    2. Davis AM, Teague SJ (1999) Angew Chem Int Ed Engl 38:736 - PubMed
    1. {'text': '', 'ref_index': 1, 'ids': [{'type': 'DOI', 'value': '10.1110/ps.21302', 'is_inner': False, 'url': 'https://doi.org/10.1110/ps.21302'}, {'type': 'PMC', 'value': 'PMC2373439', 'is_inner': False, 'url': 'https://pmc.ncbi.nlm.nih.gov/articles/PMC2373439/'}, {'type': 'PubMed', 'value': '11790828', 'is_inner': True, 'url': 'https://pubmed.ncbi.nlm.nih.gov/11790828/'}]}
    2. Ma B, Shatsky M, Wolfson HJ, Nussinov R (2002) Protein Sci 11:184 - PMC - PubMed
    1. {'text': '', 'ref_index': 1, 'ids': [{'type': 'PubMed', 'value': '16214429', 'is_inner': True, 'url': 'https://pubmed.ncbi.nlm.nih.gov/16214429/'}]}
    2. May A, Zacharias M (2005) Biochim Biophys Acta 1754:225 - PubMed

Publication types