

The effect of dose and timing of dose on the association between airborne particles and survival
- PMID: 18197301
- PMCID: PMC2199297
- DOI: 10.1289/ehp.9955
The effect of dose and timing of dose on the association between airborne particles and survival
Abstract
Background: Understanding the shape of the concentration-response curve for particles is important for public health, and lack of such understanding was recently cited by U.S. Environmental Protection Agency (EPA) as a reason for not tightening the standards. Similarly, the delay between changes in exposure and changes in health is also important in public health decision making. We addressed these issues using an extended follow-up of the Harvard Six Cities Study.
Methods: Cox proportional hazards models were fit controlling for smoking, body mass index, and other covariates. Two approaches were used. First, we used penalized splines, which fit a flexible functional form to the concentration response to examine its shape, and chose the degrees of freedom for the curve based on Akaike's information criterion. Because the uncertainties around the resultant curve do not reflect the uncertainty in model choice, we also used model averaging as an alternative approach, where multiple models are fit explicitly and averaged, weighted by their probability of being correct given the data. We examined the lag relationship by model averaging across a range of unconstrained distributed lag models.
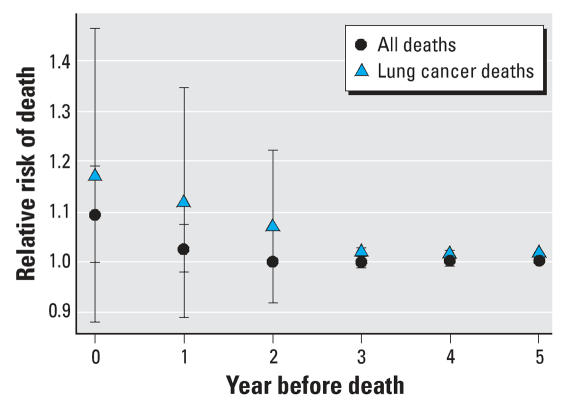
Results: We found that the concentration-response curve is linear, clearly continuing below the current U.S. standard of 15 microg/m3, and that the effects of changes in exposure on mortality are seen within two years.
Conclusions: Reduction in particle concentrations below U.S. EPA standards would increase life expectancy.
Keywords: PM2.5; air pollution; dose response; model averaging; particles; spline; survival; threshold; uncertainty.
Figures


Similar articles
-
Impact of the 1990 Hong Kong legislation for restriction on sulfur content in fuel.Res Rep Health Eff Inst. 2012 Aug;(170):5-91. Res Rep Health Eff Inst. 2012. PMID: 23316618
-
Extended follow-up and spatial analysis of the American Cancer Society study linking particulate air pollution and mortality.Res Rep Health Eff Inst. 2009 May;(140):5-114; discussion 115-36. Res Rep Health Eff Inst. 2009. PMID: 19627030
-
Part 1. Statistical Learning Methods for the Effects of Multiple Air Pollution Constituents.Res Rep Health Eff Inst. 2015 Jun;(183 Pt 1-2):5-50. Res Rep Health Eff Inst. 2015. PMID: 26333238
-
Multicity study of air pollution and mortality in Latin America (the ESCALA study).Res Rep Health Eff Inst. 2012 Oct;(171):5-86. Res Rep Health Eff Inst. 2012. PMID: 23311234
-
Research Priorities for Airborne Particulate Matter: III. Early Research Progress.Washington (DC): National Academies Press (US); 2001. Washington (DC): National Academies Press (US); 2001. PMID: 25057549 Free Books & Documents. Review.
Cited by
-
Mortality and Morbidity Effects of Long-Term Exposure to Low-Level PM2.5, BC, NO2, and O3: An Analysis of European Cohorts in the ELAPSE Project.Res Rep Health Eff Inst. 2021 Sep;2021(208):1-127. Res Rep Health Eff Inst. 2021. PMID: 36106702 Free PMC article.
-
A health impact assessment of a proposed bill to decrease speed limits on local roads in Massachusetts (U.S.A.).Int J Environ Res Public Health. 2014 Oct 2;11(10):10269-91. doi: 10.3390/ijerph111010269. Int J Environ Res Public Health. 2014. PMID: 25279544 Free PMC article.
-
Doubly Robust Additive Hazards Models to Estimate Effects of a Continuous Exposure on Survival.Epidemiology. 2017 Nov;28(6):771-779. doi: 10.1097/EDE.0000000000000742. Epidemiology. 2017. PMID: 28832358 Free PMC article.
-
Association between long-term exposure to traffic particles and blood pressure in the Veterans Administration Normative Aging Study.Occup Environ Med. 2012 Jun;69(6):422-7. doi: 10.1136/oemed-2011-100268. Epub 2012 Mar 1. Occup Environ Med. 2012. PMID: 22383587 Free PMC article.
-
Attributable Risk to Assess the Health Impact of Air Pollution: Advances, Controversies, State of the Art and Future Needs.Int J Environ Res Public Health. 2020 Jun 23;17(12):4512. doi: 10.3390/ijerph17124512. Int J Environ Res Public Health. 2020. PMID: 32585937 Free PMC article. Review.
References
-
- Akaike H. Information theory and an extension of the maximum likelihood principle. In: Petrov BN, Csaki F, editors. Second International Symposium on Information Theory. Budapest: Akademiai Kiado; 1973. pp. 267–281.
-
- Buckland S, Burnham K, Augustin N. Model selection: an integral part of inference. Biometrics. 1997;53:603–618.
-
- Clancy L, Goodman P, Sinclair H, Dockery DW. Effect of air-pollution control on death rates in Dublin, Ireland: an intervention study. Lancet. 2002;360(9341):1210–1214. - PubMed
-
- Creason J, Neas L, Walsh D, Williams R, Sheldon L, Liao D, et al. Particulate matter and heart rate variability among elderly retirees: the Baltimore 1998 PM study. J Expo Anal Environ Epidemiol. 2001;11(2):116–122. - PubMed
Publication types
MeSH terms
Substances
Grants and funding
LinkOut - more resources
Full Text Sources
Research Materials
