. 2008 Apr;35(2):185-202.
doi: 10.1007/s10928-007-9081-1. Epub 2008 Jan 16.

Extensions to the visual predictive check to facilitate model performance evaluation

Affiliations

Extensions to the visual predictive check to facilitate model performance evaluation

Teun M Post et al. J Pharmacokinet Pharmacodyn. 2008 Apr.

Abstract

The Visual Predictive Check (VPC) is a valuable and supportive instrument for evaluating model performance. However in its most commonly applied form, the method largely depends on a subjective comparison of the distribution of the simulated data with the observed data, without explicitly quantifying and relating the information in both. In recent adaptations to the VPC this drawback is taken into consideration by presenting the observed and predicted data as percentiles. In addition, in some of these adaptations the uncertainty in the predictions is represented visually. However, it is not assessed whether the expected random distribution of the observations around the predicted median trend is realised in relation to the number of observations. Moreover the influence of and the information residing in missing data at each time point is not taken into consideration. Therefore, in this investigation the VPC is extended with two methods to support a less subjective and thereby more adequate evaluation of model performance: (i) the Quantified Visual Predictive Check (QVPC) and (ii) the Bootstrap Visual Predictive Check (BVPC). The QVPC presents the distribution of the observations as a percentage, thus regardless the density of the data, above and below the predicted median at each time point, while also visualising the percentage of unavailable data. The BVPC weighs the predicted median against the 5th, 50th and 95th percentiles resulting from a bootstrap of the observed data median at each time point, while accounting for the number and the theoretical position of unavailable data. The proposed extensions to the VPC are illustrated by a pharmacokinetic simulation example and applied to a pharmacodynamic disease progression example.


Figures

Fig. 1
Fig. 1
Common display of the VPC. The dark grey dots present the observations, the dashed black lines the 5th and 95th percentiles of the model simulation and the solid black line depicts the model predicted median. The observations arise from the PK simulationMODEL 1 and the VPC from optimisation MODEL 2 (Table 1)
Fig. 2
Fig. 2
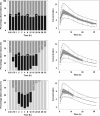
Quantified Visual Predictive Check (QVPC; left) and Bootstrap Visual Predictive Check (BVPC; right). Upper row: full dataset population PK model (Table 1, MODEL 2). Middle row: observations below 3 concentration units were removed (Table 1, MODEL 3). Lower row: observations below 5 concentration units were removed (Table 1, MODEL 4). QVPC: The distribution of the observed data around the model predicted median at each observation time (M t) is presented as a percentage of the expected amount of data. The black bar presents the observed data below M t , the dark grey bar the observed data above M t. The total of the black and grey bar combined presents the percentage of available data (n aobs,t). The light grey bar presents the percentage of unavailable observations. The white dots symbolize the percentage of n aobs,t divided by 2 on top of the percentage of unavailable observations and reflect the observed data median. BVPC: The light grey dots present the available observations. The dashed black lines present the 5th and 95th percentiles and the solid black line depicts the model predicted median of the standard VPC. The dark grey area depicts the range between the 5th and 95th percentiles of the bootstrapped median, which reflects the uncertainty range in the median of the observations. The dashed white line represents the 50th percentile of the bootstrapped median. For the models where the unavailable observations are removed, the probability for these data was set to be 100% below the model predicted median
Fig. 3
Fig. 3
Quantified Visual Predictive Check (QVPC; left) and Bootstrap Visual Predictive Check (BVPC; right) of the mechanism-based disease progression model on HbA1c measurements. Legends as described for Fig. 2. In the BVPC a probability of 50% is set for the unavailable data in the bootstrapped median assuming a random allocation of the unavailable observations around the model predicted median
Fig. 4
Fig. 4
Quantified Visual Predictive Check (QVPC) of the mechanism-based disease progression model on HbA1c measurements. Legends as described for Fig. 2. The QVPC on the left has the percentage of unavailable observations randomly allocated around the model predicted median (light grey bar). The QVPC on the right has a pattern bar included which presents the location of the unavailable observations around the model predicted median for patients leaving the study based on the position of the last available observation relative to the model predicted median (pattern bar). The light grey bar now presents the percentage of remaining unavailable observations randomly allocated around the model predicted median
Fig. 5
Fig. 5
Bootstrap Visual Predictive Check (BVPC) of the mechanism-based disease progression model optimised on 1-year data on HbA1c measurements of 270 patients during a 2-year period. Legends as described for Fig. 2 with a probability of 50% set for the unavailable data in the bootstrapped median assuming a random allocation of the unavailable observations around the model predicted median

References

    1. Bhattaram AV, et al. Impact of pharmacometrics review on new drug approval and labeling decisions — a survey of 31 new drug applications. Clin Pharmacol Ther. 2007;81:213–221. doi: 10.1038/sj.clpt.6100051. - DOI - PubMed
    1. Sheiner LB, Steimer JL. Pharmacokinetic/pharmacodynamic modelling in drug development. Annu Rev Pharmacol Toxicol. 2000;40:67–96. doi: 10.1146/annurev.pharmtox.40.1.67. - DOI - PubMed
    1. Lalonde RL, Kowalski KG, Hutmacher MM, Ewy W, Nichols DJ, Milligan PA, et al. Model-based drug development. Clin Pharmacol Ther~. 2007;82(1):21–32. doi: 10.1038/sj.clpt.6100235. - DOI - PubMed
    1. Chan PL, Holford NH. Drug treatment effects on disease progression. Annu Rev Pharmacol Toxicol. 2001;41:625–659. doi: 10.1146/annurev.pharmtox.41.1.625. - DOI - PubMed
    1. Sheiner LB. Learning versus confirming in clinical drug development. Clin Pharmacol Ther. 1997;61(3):275–291. doi: 10.1016/S0009-9236(97)90160-0. - DOI - PubMed

Substances