Comparative Study
. 2008 Jan 15;22(2):141-51.
doi: 10.1101/gad.1620408.

Regulatory divergence modifies limb length between mammals

Affiliations
Comparative Study

Regulatory divergence modifies limb length between mammals

Chris J Cretekos et al. Genes Dev. .

Abstract

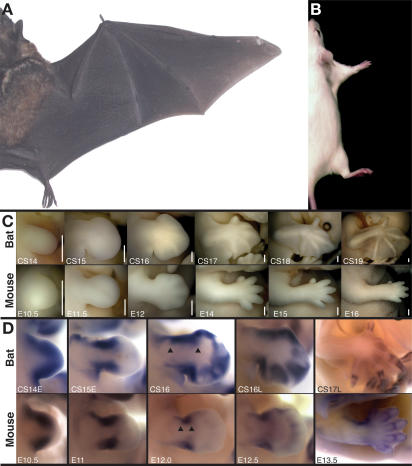
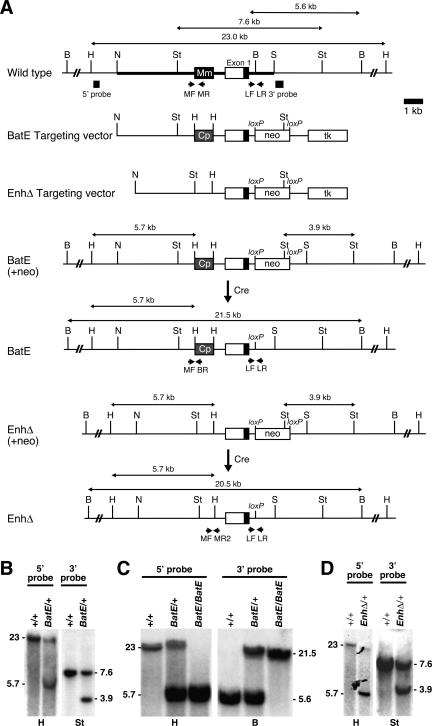
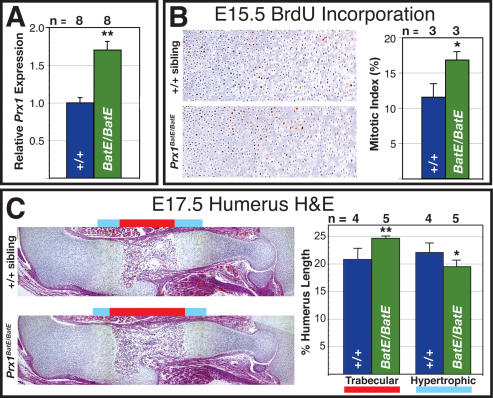
Natural selection acts on variation within populations, resulting in modified organ morphology, physiology, and ultimately the formation of new species. Although variation in orthologous proteins can contribute to these modifications, differences in DNA sequences regulating gene expression may be a primary source of variation. We replaced a limb-specific transcriptional enhancer of the mouse Prx1 locus with the orthologous sequence from a bat. Prx1 expression directed by the bat enhancer results in elevated transcript levels in developing forelimb bones and forelimbs that are significantly longer than controls because of endochondral bone formation alterations. Surprisingly, deletion of the mouse Prx1 limb enhancer results in normal forelimb length and Prx1 expression, revealing regulatory redundancy. These findings suggest that mutations accumulating in pre-existing noncoding regulatory sequences within a population are a source of variation for the evolution of morphological differences between species and that cis-regulatory redundancy may facilitate accumulation of such mutations.


Figures

Figure 1.
Figure 1.
Comparison of bat and mouse forelimb morphogenesis and Prx1 expression. Dorsal view of the right side of an adult Carollia (A) and mouse (B) scaled for equivalent body length. (C) Developmental series of Carollia (bat) and mouse forelimbs at equivalent stages, anterior at top and distal to right. Staging is according to Cretekos et al. (2005) for bat and in days post-coitum (E) for mouse and is indicated at the bottom left of each panel. Bars (bottom right of each panel), 0.5 mm. (D) Prx1 RNA expression in the developing forelimb detected by whole-mount in situ hybridization for Carollia (bat) and mouse. Staging is according to Cretekos et al. (2005) for bat and in days post-coitum (E) for mouse and is indicated at the bottom left of each panel. Views are not to scale.
Figure 2.
Figure 2.
Prx1 limb enhancer replacement and deletion by gene targeting. (A) Strategy for generating targeted alleles. The genomic region surrounding the Prx1 limb enhancer is diagrammed schematically. The targeting vector possesses 7.05 kb of total homology in three parts: 3.8 kb 5′, 2.2 kb central, and 1.05 kb 3′ homology (indicated by the thick line in wild-type allele). A PGKneobpA-lox neo expression cassette (neo) was introduced into the BamHI site of intron 1 separating the central and 3′ homologies. The neo cassette introduces a StuI restriction site used for Southern analysis. A MCTK1 expression cassette (tk) was included for negative selection. The Carollia limb enhancer (Cp) was introduced on a 1-kb HindIII restriction fragment replacing the equivalent 1-kb segment surrounding the endogenous enhancer (Mm) and separating the 5′ and central homologies (BatE targeting vector). An identical vector was also constructed but with the 1-kb enhancer segment deleted and replaced with a HindIII restriction site for Southern analysis (EnhΔ targeting vector). The positions of the external 5′ and 3′ probes used for Southern analysis to screen for targeted ES cell clones are shown below the wild-type allele. The sizes of the expected restriction fragments recognized by the probes are indicated above each allele. The neo cassettes were removed in vivo by Cre expressed from an ectopic male germline-specific Prm1-Cre transgene. (B) Southern analysis of bat enhancer replacement targeted ES cell clones. Targeted clones digested with HindIII produce 23-kb wild-type and 5.7-kb targeted bands when hybridized with an external 5′ probe. Targeted clones digested with StuI produce 7.6-kb wild-type and 3.9-kb targeted bands when hybridized with an external 3′ probe. (C) Southern analysis of Prx1BatE mice: Genomic DNA extracted from Prx1BatE/+ mice digested with HindIII and hybridized with an external 5′ probe produces 23-kb wild-type and 5.7-kb targeted bands; Prx1BatE/BatE mice produce only the 5.7-kb targeted band. Genomic DNA extracted from Prx1BatE/+ mice digested with BamHI and hybridized with an external 3′ probe produces 5.6-kb wild-type and 21.5-kb targeted bands when hybridized with an external 3′ probe; Prx1BatE/BatE mice produce only the 21.5-kb targeted band. (D) Southern analysis of enhancer deletion targeted ES clones. Targeted clones digested with HindIII produce 23-kb wild-type and 5.7-kb targeted bands when hybridized with an external 5′ probe. Targeted clones digested with StuI produce 7.6-kb wild-type and 3.9-kb targeted bands when hybridized with an external 3′ probe. (B) BamHI; (H) HindIII; (N) NsiI; (S) SalI; (St) StuI.
Figure 3.
Figure 3.
Forelimb length of Prx1 mutants. Limb morphometry at E18.5 (A) and E15.5 (B). An example of the right forelimb of a Prx1BatE/BatE, a Prx1+/+ sibling, and a Prx1−/−-null mutant of comparable mass, stained with alizarin red for minerized bone and alcian blue for cartilage (A) or alcian blue alone (B). (A) Mass-normalized limb measurements for E18.5 pups are shown as percentage difference relative to average wild type. Prx1BatE/BatE forelimbs are on average 6% longer than wild type at E18.5 (Student’s t-test P = 0.01); mass-normalized average forelimb length of E18.5 Prx1loxP/loxP controls; Prx1EnhΔ/EnhΔ and Prx1−/− mutants processed identically are shown for comparison. (B) Mass-normalized limb measurements for E15.5 pups are summarized: Average length of Prx1BatE/BatE forelimbs is not significantly different from wild-type siblings at E15.5. Genotype, sample size (n), and Student’s t-test P value are indicated above. (**) P ≤ 0.01; (‡) P > 0.05. Error bars show standard error for each sample set.
Figure 4.
Figure 4.
Quantification of Prx1 expression and long bone growth in Prx1BatE/BatE mutant forelimbs. (A) Average Prx1 expression level in developing Prx1BatE/BatE forelimb long bones is 1.7-fold higher than wild type, quantified by real-time QRT–PCR analysis of total RNA purified from humeri dissected from eight Prx1BatE/BatE compared with eight Prx1+/+ siblings at E17.5 and shown graphically. (B) Long bone chondrocyte proliferation is elevated by ∼6% at E15.5 in Prx1BatE/BatE mutants. Immunohistochemical detection of BrdU incorporation in equivalent sections of the proximal humerus growth plate in pulse-labeled E15.5 Prx1BatE/BatE and Prx1+/+ sibling. Average increase in mitotic index of three Prx1BatE/BatE compared with three Prx1+/+ siblings is shown graphically at the right. (C) Equivalent sections of the stylopod of E17.5 Prx1BatE/BatE and Prx1+/+ sibling stained with hematoxylin/eosin. The proportion of overall humerus longitudinal length comprised of trabecular bone and hypertrophic cartilage in five Prx1BatE/BatE and four Prx1+/+ siblings is shown graphically at the right. Error bars show standard error for each sample set. (**) P ≤ 0.01; (*) P ≤ 0.05.

Comment in

References

    1. Atchison M.L. Enhancers: Mechanisms of action and cell specificity. Annu. Rev. Cell Biol. 1988;4:127–153. - PubMed
    1. Ausubel F.M. Current protocols in molecular biology. John Wiley & Sons; New York: 1989.
    1. Behringer R.R., Finegold M.J., Cate R.L. Mullerian-inhibiting substance function during mammalian sexual development. Cell. 1994;79:415–425. - PubMed
    1. Brinster R.L., Chen H.Y., Trumbauer M.E., Yagle M.K., Palmiter R.D. Factors affecting the efficiency of introducing foreign DNA into mice by microinjecting eggs. Proc. Natl. Acad. Sci. 1985;82:4438–4442. - PMC - PubMed
    1. Carroll S.B. Evolution at two levels: On genes and form. PLoS Biol. 2005;3:e245. doi: 10.1371/journal.pbio.0030245. - DOI - PMC - PubMed

Publication types