

doi: 10.1016/j.jneumeth.2007.11.029.
Epub 2007 Dec 8.
In vivo time-lapse fluorescence imaging of individual retinal ganglion cells in mice
Affiliations
- PMID: 18199485
- PMCID: PMC2279147
- DOI: 10.1016/j.jneumeth.2007.11.029
Item in Clipboard
In vivo time-lapse fluorescence imaging of individual retinal ganglion cells in mice
J Neurosci Methods.
.
Abstract
We have developed a technique that permits time-lapse imaging of retinal ganglion cells (RGCs), their dendritic arbors and their axons in mammals in vivo. This technique utilizes a standard confocal laser scanning microscope, transgenic mice that express yellow fluorescent protein (YFP) in a subset of RGCs and survival anesthesia techniques. The same individual RGCs with their dendritic arbors and axons were multiply imaged in vivo in both adult and juvenile mice. Additionally, the same RGC that was imaged in vivo could then be located and imaged in fixed retinal whole mount preparations. This novel technique has many potential applications.
Conflict of interest statement
No financial disclosures or conflicts of interest for either author.
Figures
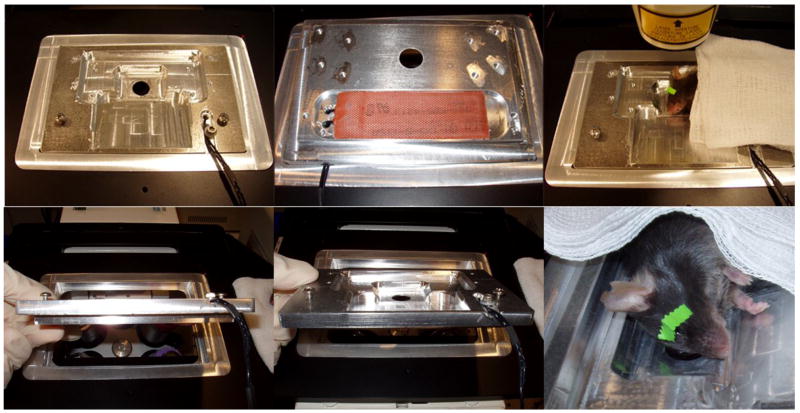
Top Left: top view of the aluminum stage with a central depressed 6 mm window for imaging. Top Middle: underside view with heating element. Top Right: mouse in imaging position. Lower Left: side view of aluminum stage. Lower Middle: oblique view of aluminum stage. Lower Right: mouse in imaging position; note glass coverslip.
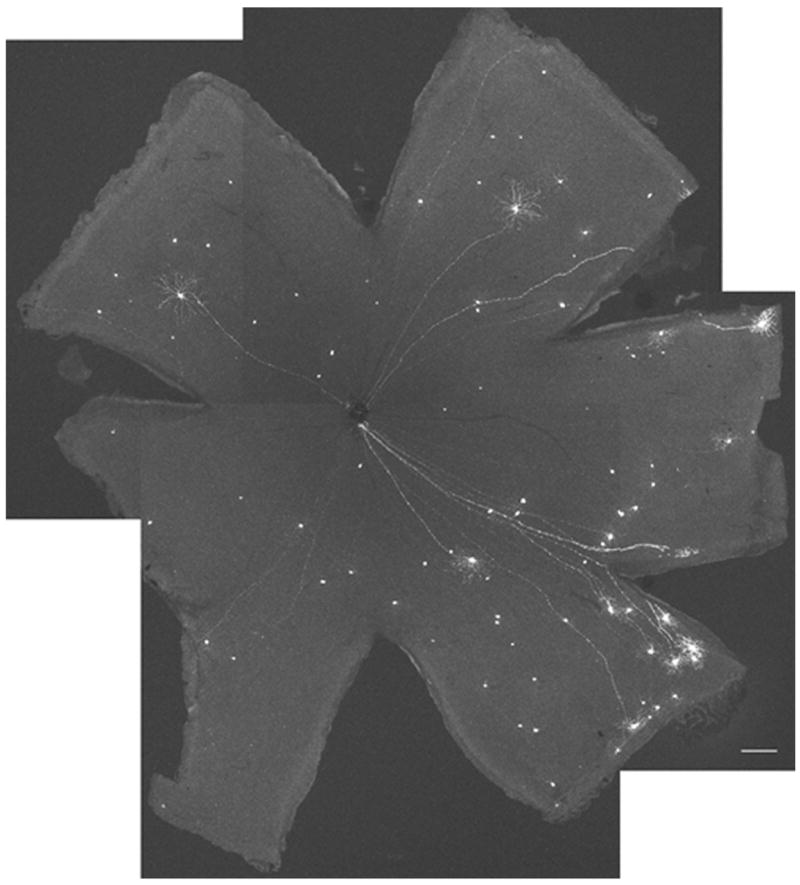
This is a montage of a whole mount fixed adult mouse retina from the YFP-H transgenic line. Typically 50 – 100 RGCs are YFP positive. The intensity of YFP fluorescence can vary among the positive neurons. Acquisition settings: 5x objective, 0.7 zoom, stack size: 2606 μm x 2606 μm x 127–211 μm, pixel size: 2.54 μm x 2.54 μm x 21.1 μm, laser power 10%, pinhole 67 μm, pixel time 3.2 μs, projection, scale bar 200 μm.
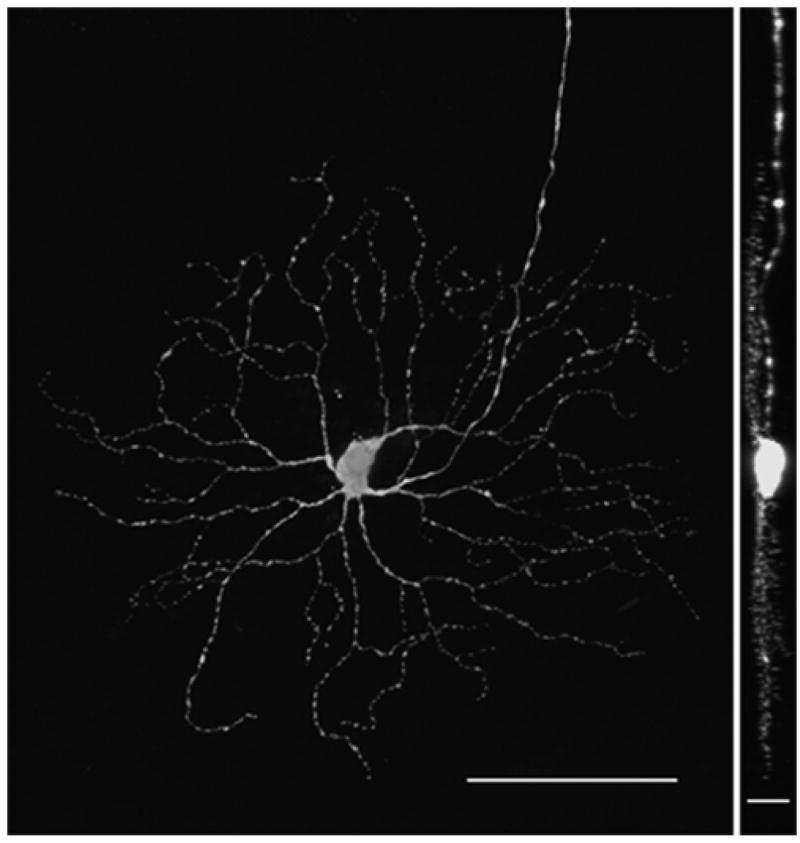
This is a single YFP-positive RGC in an adult fixed whole mount retina. The dendritic arbor and boutons are appreciated as well as the axon exiting the field of view superiorly. Left: en face view. Right: 90 degree view. Acquisition settings: 20x objective, no zoom, stack size: 461 x 461 x 26.5 μm, pixel size: 0.45 x 0.45 x 0.95 μm, pixel time 1.6 μs, laser power 10%, pinhole 61 μm, projections, scale bars: 100 μm (left) and 20 μm (right).

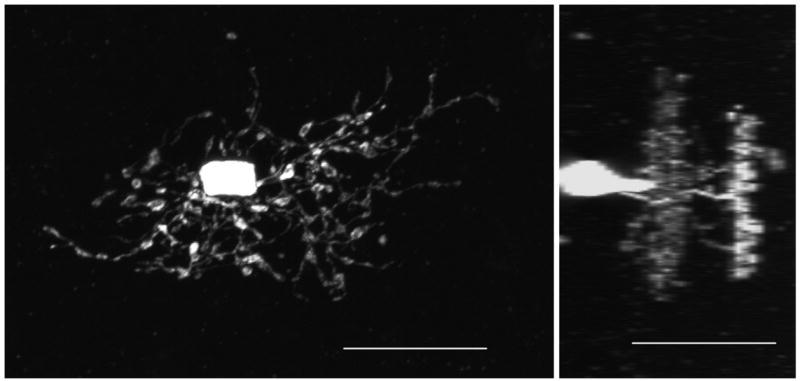
Various morphologic subtypes of RGCs are YFP-positive in these mice. Of approximately 500 YFP-positive retinal neurons screened, 2 non-RGCs were found, one of which is located inferiorly in this image. It appears to be a bistratified amacrine cell (See Figure 5). Left: en face view. Right: 90 degree view. Acquisition settings: 20x objective, no zoom, stack size: 461 x 461 x 38 μm, pixel size: 0.45 x 0.45 x 1 μm, pixel time 1.6 μs, laser power 10%, pinhole 61 μm, projections, scale bars: 50 μm (left) and 20 μm (right).
This is the same amacrine cell imaged in Figure 2 in whole mount fixed retina. Its dendritic tree is bistratified and is one of only 2 found out of approximately 500 screened YFP-positive neurons. The second amacrine cell had a similar morphology (data not shown). Left: en face view. Right: 90 degree view. Acquisition settings: 40x oil objective, 3x zoom, stack size: 77 x 77 x 33 μm, pixel size: 0.07 x 0.07 x 1 μm, pixel time 1.6 μs, laser power 10%, pinhole 71 μm, projections, scale bars: 20 μm (left) and 20 μm (right).
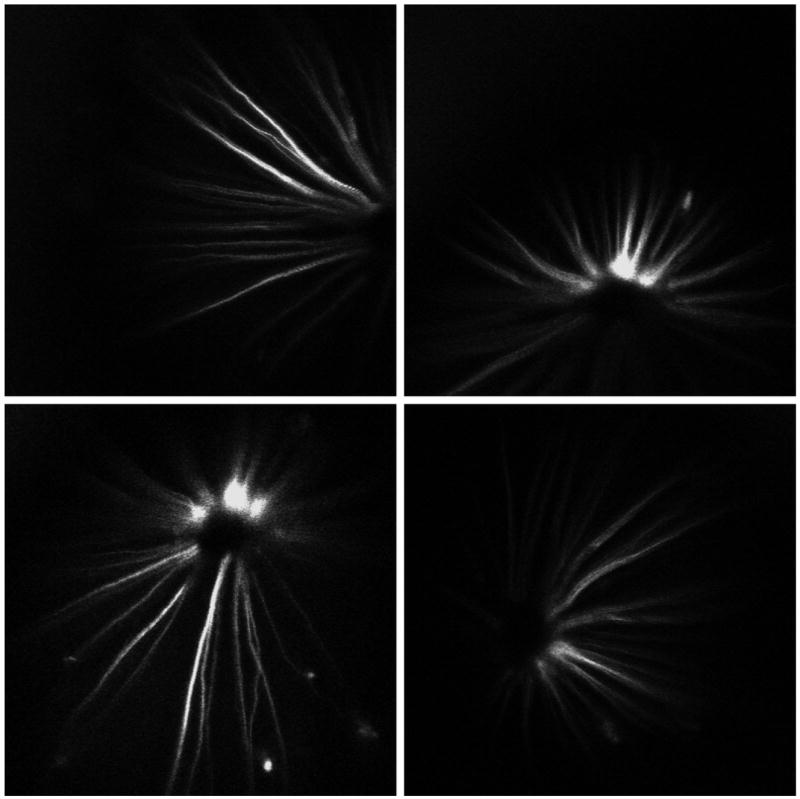
These are images taken in vivo from the right eye of an adult mouse showing multiple YFP-positive axons entering the optic nerve head and rare RGC bodies in the peripapillary region. Acquisition settings: 5x objective, no zoom, single image planes, pixel time 1.6 μs, laser power 53%, pinhole 1000 μm.

Using a 10x Plan-Neo/0.3 NA objective, this RGC’s dendritic arbor details were imaged in vivo (See also Figure 6). Acquisition settings: 10x objective, no zoom, single image plane, pixel time 1.6 μs, laser power 51%, pinhole 545 μm.

Soon after anesthesia, this animal stopped breathing. Therefore these in vivo images, taken immediately after cessation of breathing, do not have breathing movement artifacts. Z stacks of images were thereby obtained. The eye was then fixed, and the same RGC was imaged in whole mount. Left panel acquisition settings: 5x objective, no zoom, z stack, projection, pixel time 1.6 μs, laser power 10%, pinhole 294 μm. Right panel: 20x objective, no zoom, stack size: 461 x 461 x 28 μm, pixel size: 0.45 x 0.45 x 1 μm, pixel time 1.6 μs, laser power 10%, pinhole 61 μm, projection, scale bar: 50 μm; fixed image inverted to match orientation of in vivo image.
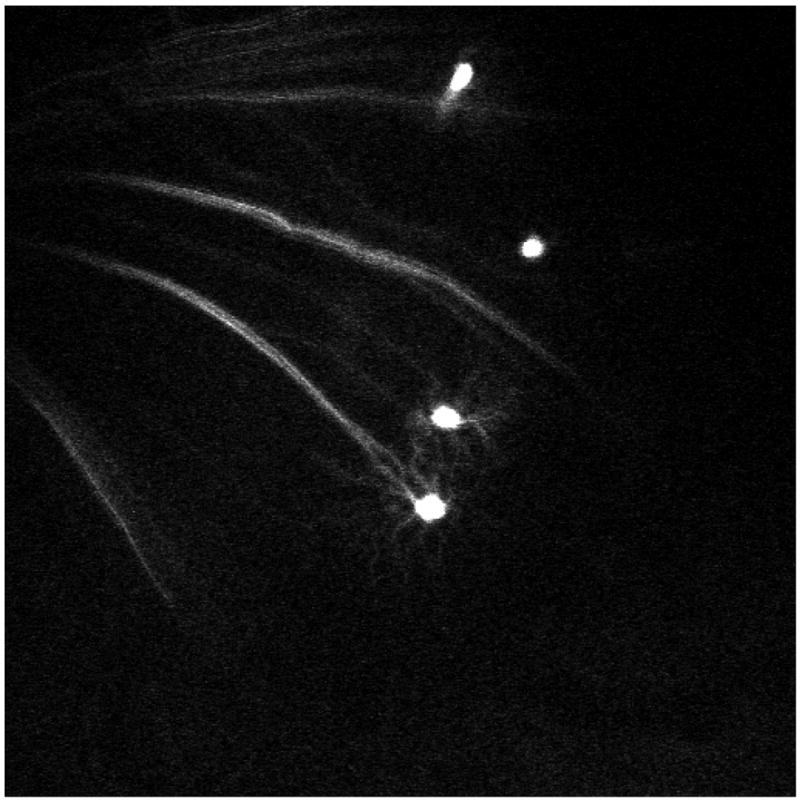
In this 4 week old mouse image, 4 RGC bodies can be appreciated. Dendritic details are apparent in 2 of the RGCs. Acquisition settings: 5x objective, no zoom, single image plane, pixel time 1.6 μs, laser power 52%, pinhole 761 μm.
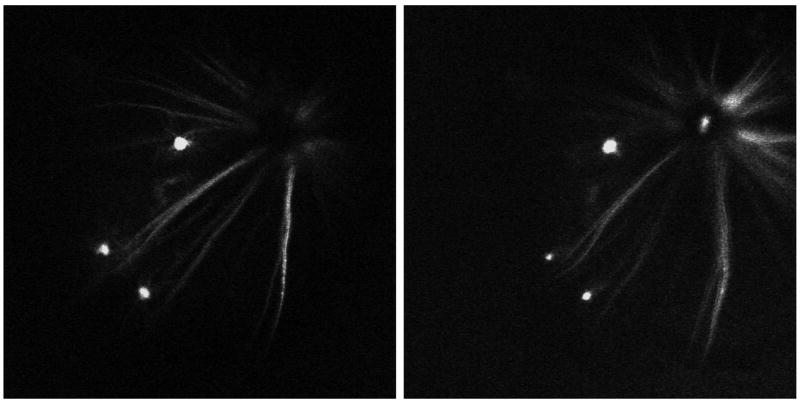
This 4 week juvenile mouse was imaged at day 0 (left), and then again on day 2 (right). 3 RGCs are appreciated in this peripapillary region. Acquisition settings: 5x objective, no zoom, single image plane, pixel time 1.6 μs; Day 0: laser power 51%, pinhole 454 μm; Day 2: laser power 52%, pinhole 670 μm.
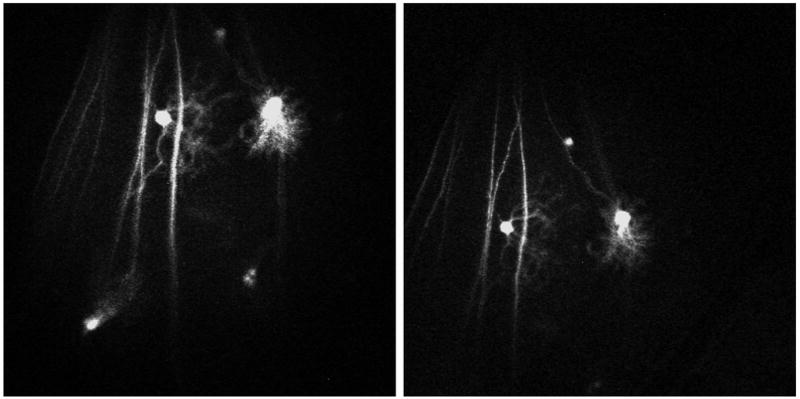
This region of the retina in an adult mouse was imaged in vivo, the animal was survived then imaged again 2 days later. The 2 central RGCs have differing dendritic morphologies which are grossly stable over the 2 day interval. Acquisition settings: 5x objective, no zoom, single image plane, pixel time 1.6 μs; Day 0: laser power 53%, pinhole 1000 μm; Day 2: laser power 51%, pinhole 636 μm.
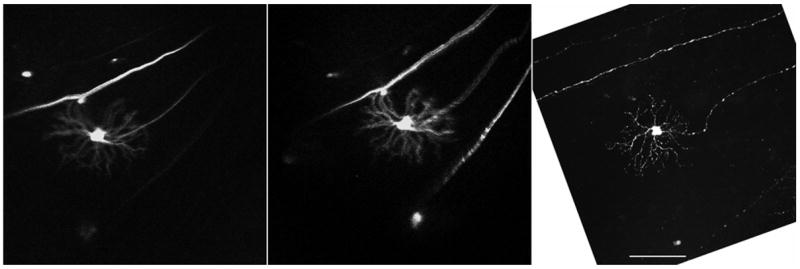
This RGC was imaged initially in vivo, the animal was survived and then imaged again the next day in vivo, after which the same RGC was imaged in fixed whole mount preparation the same day. There appears to be some artifactual stretching of the tissue in the fixed preparation, as the distance between the dendritic arbor and the nearby axons is increased relative to the in vivo image. By utilizing low power views of the entire retina as a map we are assured that the fixed cell is the same as that imaged in vivo. Left panel acquisition settings: 5x objective, no zoom, single image plane, pixel time 1.6 μs, laser power 51%, pinhole 636 μm. Center panel: 5x objective, no zoom, single image plane, pixel time 1.6 μs, laser power 52%, pinhole 761 μm. Right panel: 20x objective, no zoom, stack size: 461 x 461 x 34 μm, pixel size: 0.45 x 0.45 x 3.8 μm, pixel time 1.6 μs, laser power 15%, pinhole 61 μm, projection, scale bar: 100 μm; fixed image inverted & rotated to match orientation of in vivo images.
References
-
- Arras M, Autenried P, Rettich A, Spaeni D, Rulicke T. Optimization of intraperitoneal injection anesthesia in mice: drugs, dosages, adverse effects, and anesthesia depth. Comp Med. 2001;51(5):443–456. - PubMed
-
- Chalupa LM. Developing dendrites demonstrate unexpected specificity. Neuron. 2006;52(4):567–8. - PubMed
-
- Engelmann R, Sabel BA. In vivo imaging of mammalian central nervous system neurons. Methods Enzymol. 1999;307:563–570. - PubMed
-
- Feng G, Mellor RH, Bernstein M, Keller-Peck C, Nguyen QT, Wallace M, et al. Imaging neuronal subsets in transgenic mice expressing multiple spectral variants of GFP. Neuron. 2000;28(1):41–51. - PubMed
Publication types
MeSH terms
Substances
Grants and funding
LinkOut - more resources
Full Text Sources
