

CSN5 isopeptidase activity links COP9 signalosome activation to breast cancer progression
- PMID: 18199546
- PMCID: PMC2646416
- DOI: 10.1158/0008-5472.CAN-07-3060
CSN5 isopeptidase activity links COP9 signalosome activation to breast cancer progression
Abstract
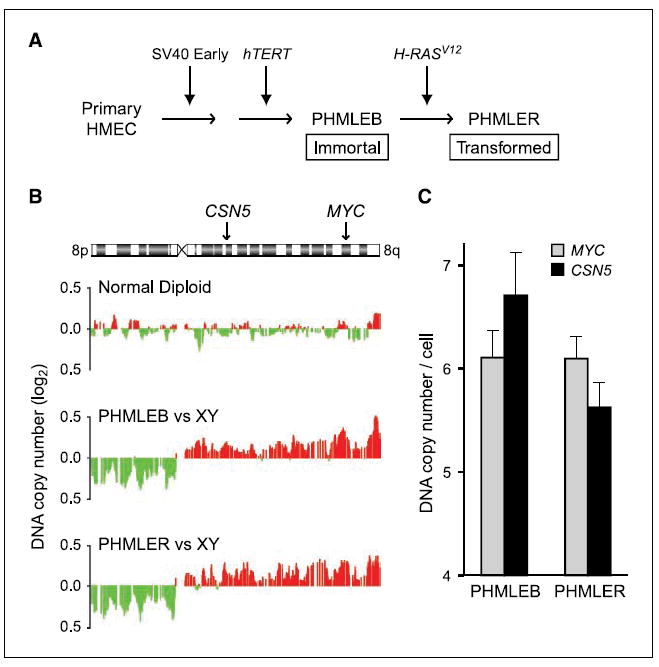
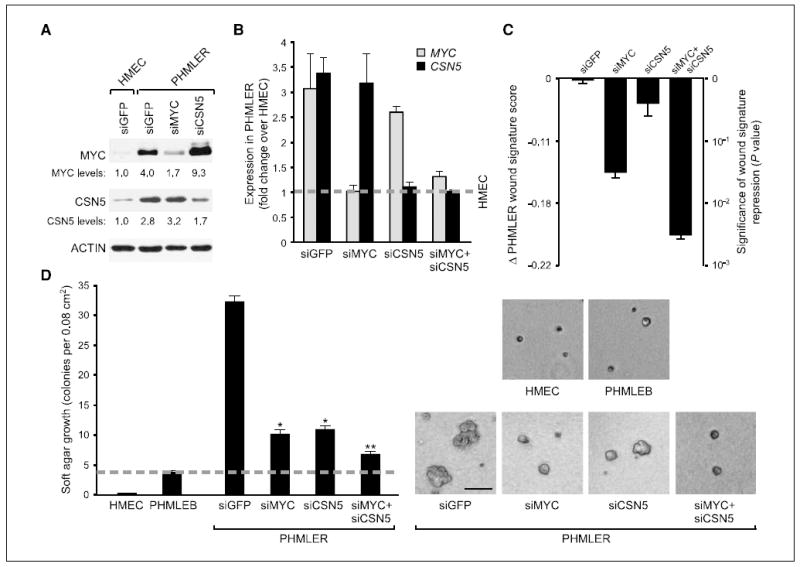
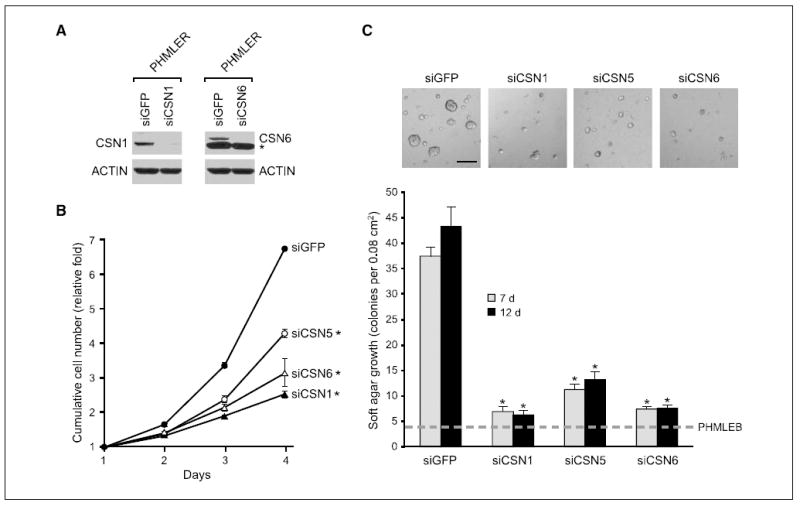
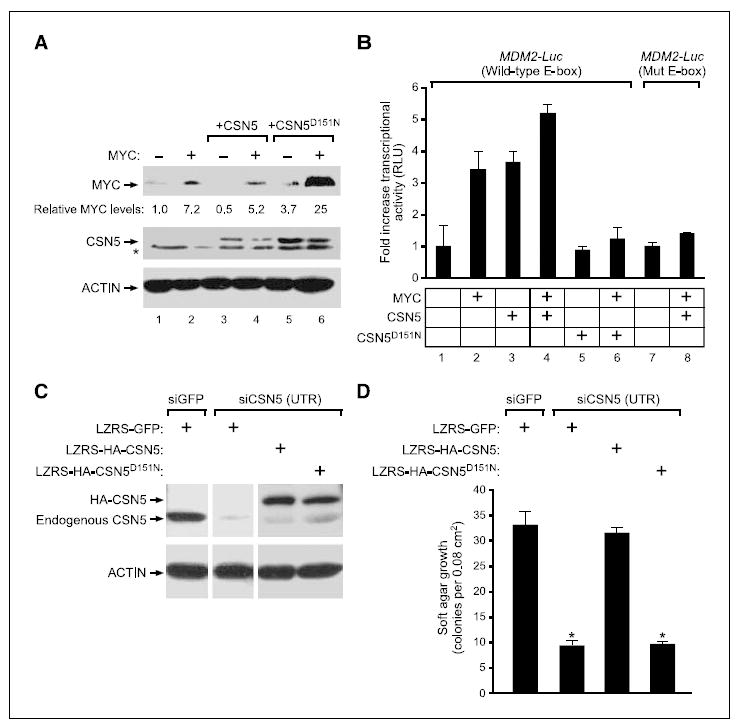
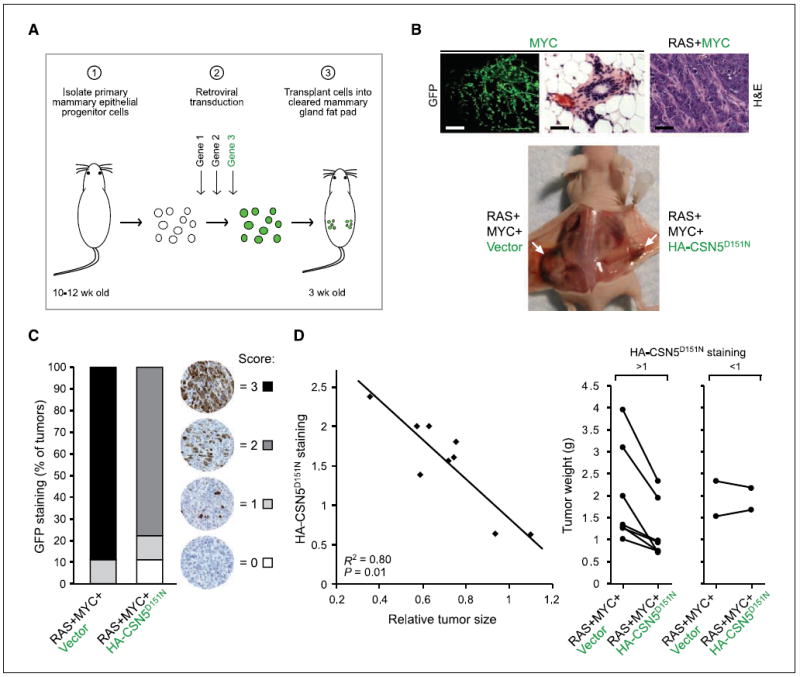
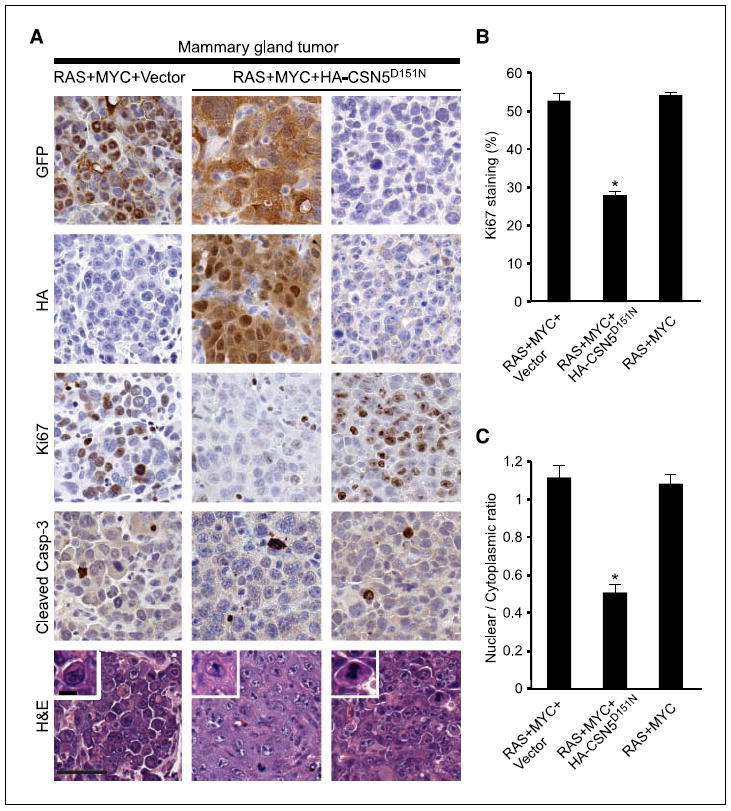
CSN5 has been implicated as a candidate oncogene in human breast cancers by genetic linkage with activation of the poor-prognosis, wound response gene expression signature. CSN5 is a subunit of the eight-protein COP9 signalosome, a signaling complex with multiple biochemical activities; the mechanism of CSN5 action in cancer development remains poorly understood. Here, we show that CSN5 isopeptidase activity is essential for breast epithelial transformation and progression. Amplification of CSN5 is required for transformation of primary human breast epithelial cells by defined oncogenes. The transforming effects of CSN5 require CSN subunits for assembly of the full COP9 signalosome and the isopeptidase activity of CSN5, which potentiates the transcriptional activity of MYC. Transgenic inhibition of CSN5 isopeptidase activity blocks breast cancer progression evoked by MYC and RAS in vivo. These results highlight CSN5 isopeptidase activity in breast cancer progression, suggesting it as a therapeutic target in aggressive human breast cancers.
Figures
Similar articles
-
COP9 signalosome subunit Csn8 is involved in maintaining proper duration of the G1 phase.J Biol Chem. 2013 Jul 12;288(28):20443-52. doi: 10.1074/jbc.M113.468959. Epub 2013 May 20. J Biol Chem. 2013. PMID: 23689509 Free PMC article.
-
Roles of COP9 signalosome in cancer.Cell Cycle. 2011 Sep 15;10(18):3057-66. doi: 10.4161/cc.10.18.17320. Epub 2011 Sep 15. Cell Cycle. 2011. PMID: 21876386 Free PMC article. Review.
-
Insights into the regulation of the human COP9 signalosome catalytic subunit, CSN5/Jab1.Proc Natl Acad Sci U S A. 2013 Jan 22;110(4):1273-8. doi: 10.1073/pnas.1209345110. Epub 2013 Jan 3. Proc Natl Acad Sci U S A. 2013. PMID: 23288897 Free PMC article.
-
Structural and biochemical characterization of the Cop9 signalosome CSN5/CSN6 heterodimer.PLoS One. 2014 Aug 21;9(8):e105688. doi: 10.1371/journal.pone.0105688. eCollection 2014. PLoS One. 2014. PMID: 25144743 Free PMC article.
-
Plant COP9 signalosome subunit 5, CSN5.Plant Sci. 2014 Jul;224:54-61. doi: 10.1016/j.plantsci.2014.04.001. Epub 2014 Apr 8. Plant Sci. 2014. PMID: 24908506 Review.
Cited by
-
COPS5 amplification and overexpression confers tamoxifen-resistance in ERα-positive breast cancer by degradation of NCoR.Nat Commun. 2016 Jul 4;7:12044. doi: 10.1038/ncomms12044. Nat Commun. 2016. PMID: 27375289 Free PMC article.
-
COP9 signalosome subunit 5 regulates cancer metastasis by deubiquitinating SNAIL.Oncotarget. 2018 Apr 17;9(29):20670-20680. doi: 10.18632/oncotarget.25060. eCollection 2018 Apr 17. Oncotarget. 2018. PMID: 29755680 Free PMC article.
-
COP9 signalosome subunit Csn8 is involved in maintaining proper duration of the G1 phase.J Biol Chem. 2013 Jul 12;288(28):20443-52. doi: 10.1074/jbc.M113.468959. Epub 2013 May 20. J Biol Chem. 2013. PMID: 23689509 Free PMC article.
-
COP9 signalosome subunit CSN5, but not CSN6, is upregulated in lung adenocarcinoma and predicts poor prognosis.J Thorac Dis. 2018 Mar;10(3):1596-1606. doi: 10.21037/jtd.2018.02.09. J Thorac Dis. 2018. PMID: 29707311 Free PMC article.
-
GOLM1 dictates acquired Lenvatinib resistance by a GOLM1-CSN5 positive feedback loop upon EGFR signaling activation in hepatocellular carcinoma.Oncogene. 2024 Oct;43(42):3108-3120. doi: 10.1038/s41388-024-03153-7. Epub 2024 Sep 9. Oncogene. 2024. PMID: 39251847
References
-
- Robanus-Maandag EC, Bosch CA, Kristel PM, et al. Association of C-MYC amplification with progression from the in situ to the invasive stage in C-MYC-amplified breast carcinomas. J Pathol. 2003;201:75–82. - PubMed
-
- Tirkkonen M, Tanner M, Karhu R, Kallioniemi A, Isola J, Kallioniemi OP. Molecular cytogenetics of primary breast cancer by CGH. Genes Chromosomes Cancer. 1998;21:177–84. - PubMed
Publication types
MeSH terms
Substances
Grants and funding
LinkOut - more resources
Full Text Sources
Other Literature Sources
Medical
Molecular Biology Databases
