. 2008 Feb;49(2):216-24.
doi: 10.2967/jnumed.107.045484. Epub 2008 Jan 16.

Diagnostic performance of an expert system for interpretation of 99mTc MAG3 scans in suspected renal obstruction

Affiliations

Diagnostic performance of an expert system for interpretation of 99mTc MAG3 scans in suspected renal obstruction

Andrew Taylor et al. J Nucl Med. 2008 Feb.

Abstract

The purpose of the study was to compare diuresis renography scan interpretation generated by a renal expert system with the consensus interpretation of 3 expert readers.

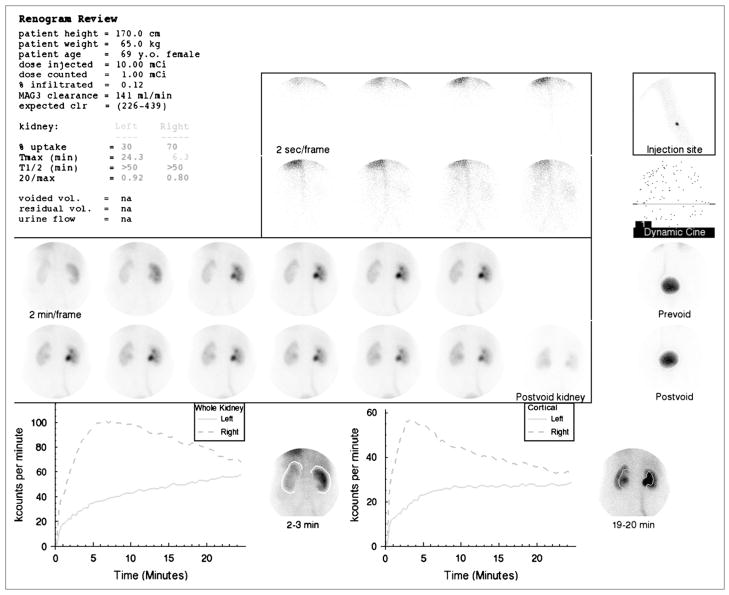
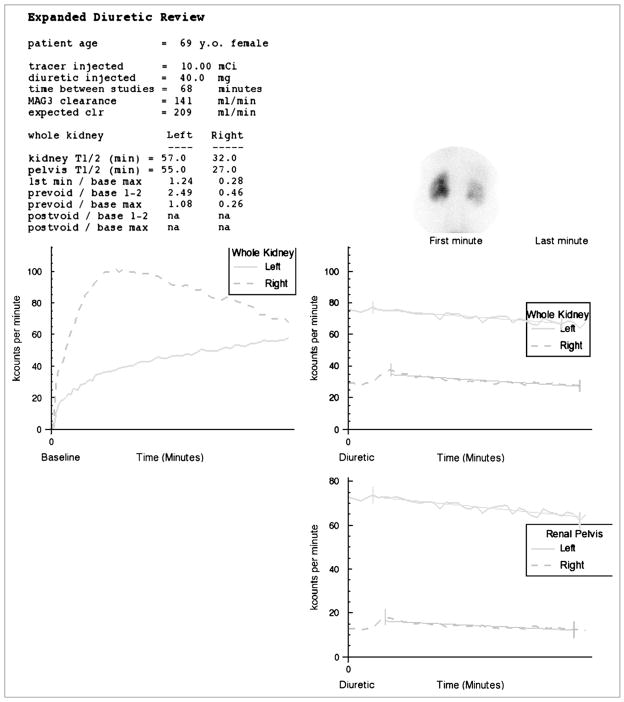
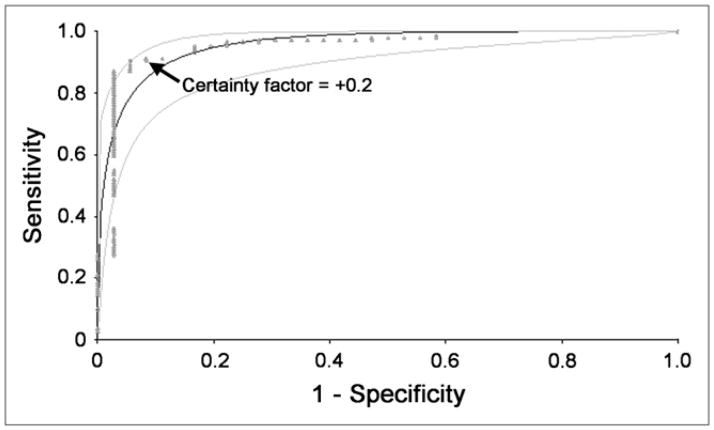
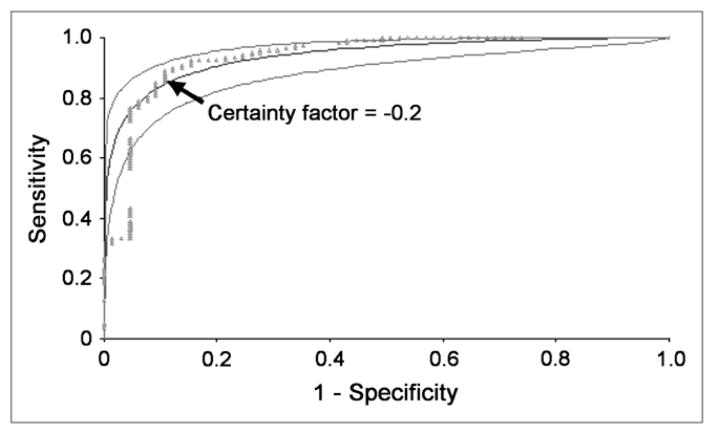
Methods: The expert system was evaluated in 95 randomly selected furosemide-augmented patient studies (185 kidneys) obtained for suspected obstruction; there were 55 males and 40 females with a mean age +/- SD of 58.6 +/- 16.5 y. Each subject had a baseline (99m)Tc-mercaptoacetyltriglycine ((99m)Tc-MAG3) scan followed by furosemide administration and a separate 20-min acquisition. Quantitative parameters were automatically extracted from baseline and furosemide acquisitions and forwarded to the expert system for analysis. Three experts, unaware of clinical information, independently graded each kidney as obstructed/probably obstructed, equivocal, and probably nonobstructed/nonobstructed; experts resolved differences by a consensus reading. These 3 expert categories were compared with the obstructed, equivocal, and nonobstructed interpretations provided by the expert system. Agreement was assessed using weighted kappa, and the predictive accuracy of the expert system compared with expert readers was assessed by the area under receiver-operating-characteristic (ROC curve) curves.

Results: The expert system agreed with the consensus reading in 84% (101/120) of nonobstructed kidneys, in 92% (33/36) of obstructed kidneys, and in 45% (13/29) of equivocal kidneys. The weighted kappa between the expert system and the consensus reading was 0.72 and was comparable with the weighted kappa between experts. There was no significant difference in the areas under the ROC curves when the expert system was compared with each expert using the other 2 experts as the gold standard.

Conclusion: The renal expert system showed good agreement with the expert interpretation and could be a useful educational and decision support tool to assist physicians in the diagnosis of renal obstruction. To better mirror the clinical setting, algorithms to incorporate clinical data must be designed, implemented, and tested.


Conflict of interest statement

The terms of this arrangement have been reviewed and approved by Emory University in accordance with its conflict-of-interest practice.

Figures

FIGURE 1
FIGURE 1
Standard display shows demographic data, dose injected, dose counted on camera, percent dose infiltrated, 99mTc-MAG3 clearance and expected 99mTc-MAG3 clearance followed by percent uptake, Tmax, T1/2, and 20 min/max ratios for whole-kidney ROI. Voided volume, postvoid residual, and urine flow rate were not measured. (Upper central panel) Two-second images at beginning of acquisition. (Upper right panel) Injection site; just beneath is a frame for viewing dynamic cine and pre- and postvoid bladder images. (Center panel) Twelve 2-min images followed by postvoid image of kidneys with patient lying on camera in same position as that for initial images. (Lower left panel) Whole-kidney ROIs and whole-kidney renogram curves. (Lower right panel) Cortical ROIs and cortical renogram curves. 99mTc-MAG3 clearance was reduced (141 mL/min/1.73m2 compared with normal range of 226–439 mL/min/1.73 m2). Relative uptake of left kidney was 30%. T1/2 of both kidneys was >50 min and 20 min/max ratio was bilaterally abnormal; consequently, patient received furosemide followed by a second acquisition (Fig. 2 and Supplemental Fig. 2).
FIGURE 2
FIGURE 2
Display of baseline and furosemide whole-kidney renogram curves on same scale. Time–activity curve generated by pelvic ROI is also displayed on an expanded scale. Patient’s global renal function is reduced and there is diffuse retention in right kidney compatible with reduced function; however, tracer largely washed out of the right renal pelvis, and the ratio of prevoid furosemide counts to maximal counts on baseline study was only 0.26, indicating that about 75% of maximum activity had washed out of right kidney. Experts interpreted right kidney as “probably not obstructed.” RENEX also interpreted right kidney as nonobstructed (certainty factor of −0.37). Experts interpreted left kidney as “probably obstructed.” Absolute function and relative function were reduced in left kidney; there was gradual increase in tracer activity in the left renal pelvis and minimal washout after furosemide administrations. RENEX also interpreted left kidney as obstructed (certainty factor of 0.76) (Supplemental Fig. 2).
FIGURE 3
FIGURE 3
Clinical data were used to confirm that +0.2 was an acceptable certainty factor for RENEX to separate obstructed kidneys from the combined group of equivocal and non-obstructed kidneys. Kidneys considered to be equivocal or obstructed by consensus analysis were combined, and ROC curves were constructed to compare performance of RENEX with consensus interpretation with regard to distinguishing between obstructed kidneys and the combined group of nonobstructed and equivocal kidneys. ROC analysis was performed for certainty factors ranging from −1.0 to +1.0. Plot of this analysis confirms the certainty factor of +0.2 to be an acceptable threshold for separating obstructed kidneys from the combined group. Fitted ROC curve and its 95% confidence bands are shown as smooth curves. Empiric ROC curve is shown in dots.
FIGURE 4
FIGURE 4
Clinical data were used to confirm that −0.2 was an acceptable certainty factor for RENEX to separate non-obstructed kidneys from the combined group of equivocal and obstructed kidneys. Kidneys considered to be equivocal or non-obstructed by consensus analysis were combined, and ROC curves were constructed to compare performance of RENEX with consensus interpretation with regard to distinguishing between nonobstructed kidneys and the combined group of obstructed and equivocal kidneys. ROC analysis was performed for certainty factors ranging from −1.0 to +1.0. Plot of this analysis confirms the certainty factor of −0.2 to be an acceptable threshold for separating nonobstructed kidneys from the combined group. Fitted ROC curve and its 95% confidence bands are shown as smooth curves. Empiric ROC curve is shown in dots.

Similar articles

Cited by

References

    1. O’Reilly P, Aurell M, Britton K, Kletter K, Rosenthal L, Testa T. Consensus on diuresis renography for investigating the dilated upper urinary tract. J Nucl Med. 1996;37:1872–1876. - PubMed
    1. IMV Medical Information Division. 2003 Nuclear Medicine Census Marke Summary Report. IV. Des Plaines, IL: IMV, Ltd; 2003. pp. 7–11.
    1. Garcia EV, Taylor A, Halkar R, et al. RENEX: an expert system for the interpretation of 99mTc-MAG3 scans to detect renal obstruction. J Nucl Med. 2006;47:320–329. - PubMed
    1. Garcia EV, Taylor A, Manatunga D, Folks R. A software engine to justify the conclusions of an expert system for detecting renal obstruction on 99mTc-MAG3 scans. J Nucl Med. 2007;48:463–470. - PMC - PubMed
    1. Taylor A, Hill A, Binongo J, et al. Evaluation of two diuresis renography decision support systems to determine the need for furosemide in patients with suspected obstruction. AJR. 2007;188:1395–1402. - PMC - PubMed

Publication types

Substances

LinkOut - more resources