Comparative Study
. 2008 Apr 15;94(8):2965-86.
doi: 10.1529/biophysj.107.114215. Epub 2008 Jan 16.

Comparing experimental and simulated pressure-area isotherms for DPPC

Affiliations
Comparative Study

Comparing experimental and simulated pressure-area isotherms for DPPC

Susan L Duncan et al. Biophys J. .

Abstract

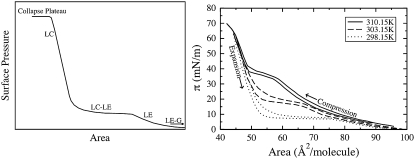
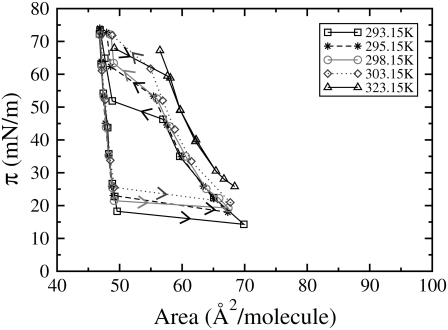
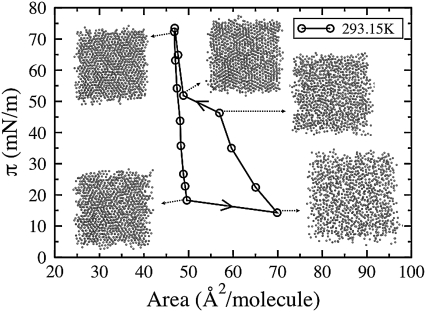
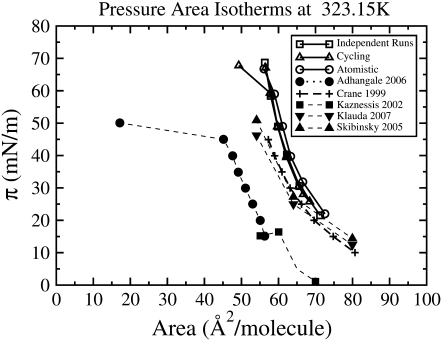
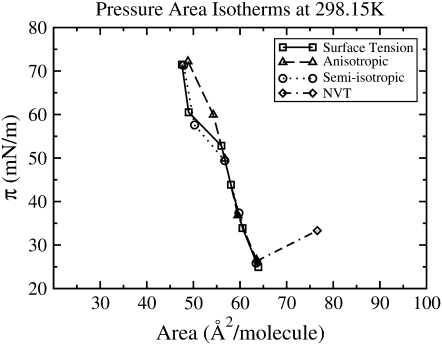
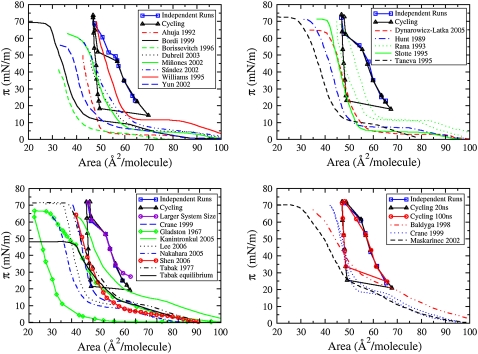
Although pressure-area isotherms are commonly measured for lipid monolayers, it is not always appreciated how much they can vary depending on experimental factors. Here, we compare experimental and simulated pressure-area isotherms for dipalmitoylphosphatidylcholine (DPPC) at temperatures ranging between 293.15 K and 323.15 K, and explore possible factors influencing the shape and position of the isotherms. Molecular dynamics simulations of DPPC monolayers using both coarse-grained (CG) and atomistic models yield results that are in rough agreement with some of the experimental isotherms, but with a steeper slope in the liquid-condensed region than seen experimentally and shifted to larger areas. The CG lipid model gives predictions that are very close to those of atomistic simulations, while greatly improving computational efficiency. There is much more variation among experimental isotherms than between isotherms obtained from CG simulations and from the most refined simulation available. Both atomistic and CG simulations yield liquid-condensed and liquid-expanded phase area compressibility moduli that are significantly larger than those typically measured experimentally, but compare well with some experimental values obtained under rapid compression.


Figures

FIGURE 1
FIGURE 1
(Left) The defining features of a typical pressure-area isotherm for DPPC near the main transition temperature. The phase regions include the liquid-condensed (LC), liquid-expanded (LE), and the LC-LE and LE-G transition regions. The LC-LE horizontal coexistence region and the horizontal collapse plateau are identified. (Right) Experimental results showing the effect of temperature on the shape of compression and expansion pressure-area isotherms of DPPC. These isotherms are reproduced from those published by Crane et al. (14), at 298.15 K (dotted line), 303.15 K (dashed line), and 310.15 K (solid line). The experimental results presented in this figure (right) and in subsequent figures were obtained using Data Thief III, Ver.1 (191).
FIGURE 2
FIGURE 2
Our pressure-area isotherms, obtained using cycling of coarse-grained simulations at 293.15 K (squares), 295.15 K (asterisks), 298.15 K (circles), 303.15 K (diamonds), and 323.15 K (triangles). The arrows indicate the direction of cycling. In this and subsequent figures, the error bars (standard error) on our simulated isotherms are roughly the same size as the symbols.
FIGURE 3
FIGURE 3
Coarse-grained pressure-area isotherm obtained by cycling at 293.15 K and corresponding images of the packing of C2 tail beads (from both monolayers) at various points along the isotherm.
FIGURE 4
FIGURE 4
Comparison of simulated and experimental pressure-area isotherms at 323.15 K: our independent coarse-grained simulations (□), our cycling coarse-grained simulations (▵), our atomistic simulations (○), the atomistic simulations of Kaznessis et al. (24) (▪), Klauda et al. (26) (▾), Skibinsky et al. (42) (▴), the coarse-grained simulations of Adhangale et al. (32) (•), and the experimental results obtained by Crane et al. (14) using the captive bubble apparatus (+). For simplicity, our simulations are denoted by open symbols and solid lines, experiments are denoted by characters and dashed lines, and solid symbols and dotted lines denote simulations by other groups.
FIGURE 5
FIGURE 5
Coarse-grained pressure-area isotherms obtained at 298.15 K using the NVT ensemble (diamonds) and the NPT ensemble with three pressure coupling mechanisms: surface tension (squares), anisotropic (triangles), and semiisotropic (circles).
FIGURE 6
FIGURE 6
P-N tilt angle distribution for atomistic simulations at 323.15 K with areas 56 Å2/molecule and 73 Å2/molecule, for coarse-grained (CG) simulations with 1028 lipids/monolayer at 298.15 K with areas 48 Å2/molecule and 68 Å2/molecule, and for coarse-grained simulations with 256 lipids/monolayer at 323.15 K with areas 56 Å2/molecule and 71 Å2/molecule. The solid, dark-shaded, and light-shaded lines represent the atomistic simulations, and CG simulations at 298.15 K and 323.15 K, respectively. For each shade, the solid and dotted lines represent the smaller and larger area per lipid, respectively. For clarity, the data shown here has been smoothed using time-averaged values.
FIGURE 7
FIGURE 7
Radial distribution functions. (Left) Independent coarse-grained (CG) simulations at 298.15 K for the larger system size (1024 lipids/monolayer) at both 48 Å2/molecule (black) and 68 Å2/molecule (red). (A) PO4-PO4 distribution. (D) C2-C2 distribution. (Center and right) Atomistic (atom.) simulations at 323.15 K with 64 lipids/monolayer at both 56 Å2/molecule (black) and 73 Å2/molecule (red) and independent CG simulations at 323.15 K with 256 lipids/monolayer at both 56 Å2/molecule (green) and 71 Å2/molecule (blue). (B) PO4-PO4 distribution; (C) NC3-NC3 distribution; (E) C2-C2 distribution. (F) PO4-NC3 distribution.
FIGURE 8
FIGURE 8
Hole formation in atomistic (left) and coarse-grained (right) simulations at 323.15 K, from the side (top) and corresponding top view (bottom). The lipid tails and glycerol groups are shown in green, the headgroups in red, and the waters in blue. The corresponding surface tensions and simulation times are given below the images.
FIGURE 9
FIGURE 9
Comparison of simulated CG pressure-area isotherms with various experimental ones at 293.15 K (top left), 295.15 K (top right), 298.15 K (bottom left), and 303.15 K (bottom right).

Similar articles

Cited by

References

    1. Akino, T. 1992. Lipid components of the surfactant system. In Pulmonary Surfactant: From Molecular Biology to Clinical Practice. B. Robertson, L. M. G. van Golde, and J. J. Batenburg, editors. Elsevier Science Publishers, Amsterdam, The Netherlands.
    1. Keough, K. M. W. 1992. Physical chemistry of pulmonary surfactant in the terminal air spaces. In Pulmonary Surfactant: From Molecular Biology to Clinical Practice. B. Robertson, L. M. G. van Golde, and J. J. Batenburg, editors. Elsevier Science Publishers, Amsterdam, The Netherlands.
    1. Notter, R. H., S. A. Tabak, S. Holcomb, and R. D. Mavis. 1980. Postcollapse dynamic surface pressure relaxation of binary surface films containing dipalmitoyl phosphatidylcholine. J. Colloid Interface Sci. 74:370–377.
    1. Notter, R. H., R. Taubold, and R. D. Mavis. 1982. Hysteresis in saturated phospholipid films and its potential relevance for lung surfactant function in vivo. Exp. Lung Res. 3:109–127. - PubMed
    1. Knecht, V., M. Müller, M. Bonn, S. J. Marrink, and A. E. Mark. 2005. Simulation studies of pore and domain formation in a phospholipid monolayer. J. Chem. Phys. 122:24704–24712. - PubMed

Publication types

Substances

LinkOut - more resources