

Terahertz spectroscopy of bacteriorhodopsin and rhodopsin: similarities and differences
- PMID: 18199669
- PMCID: PMC2275673
- DOI: 10.1529/biophysj.107.105163
Terahertz spectroscopy of bacteriorhodopsin and rhodopsin: similarities and differences
Abstract
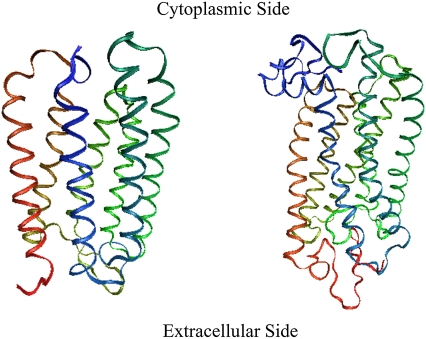
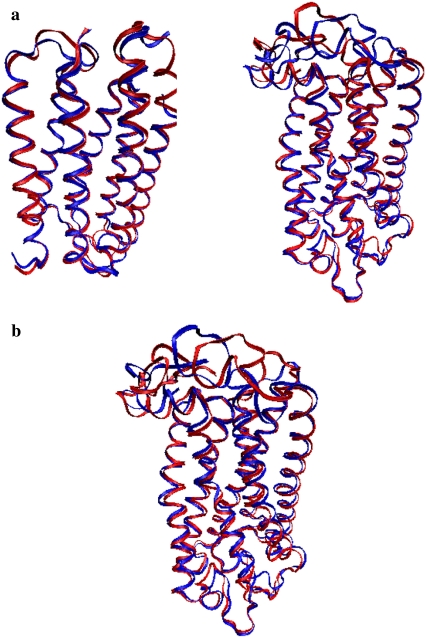
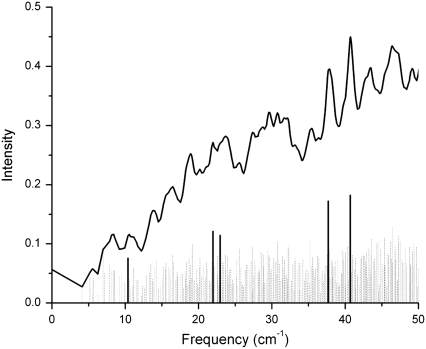
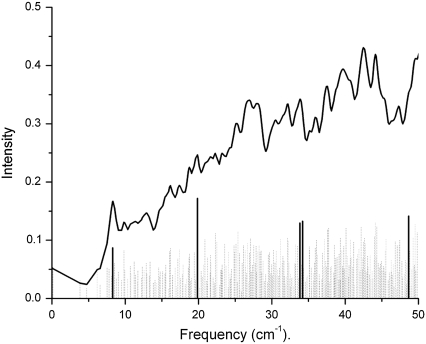
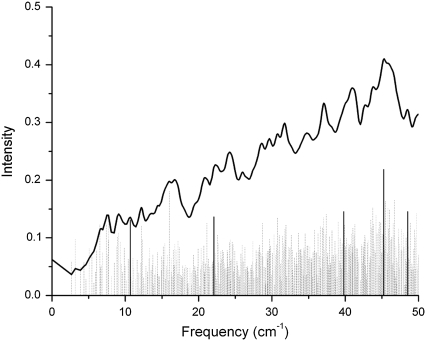
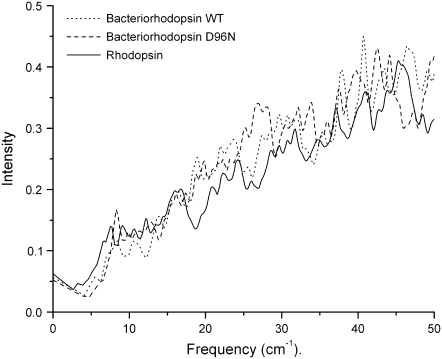
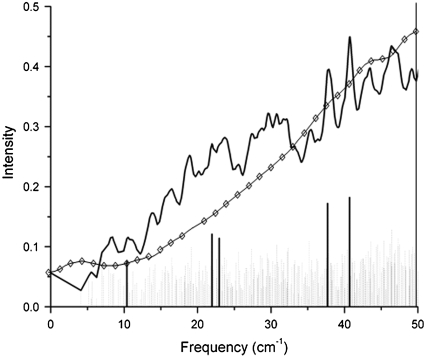
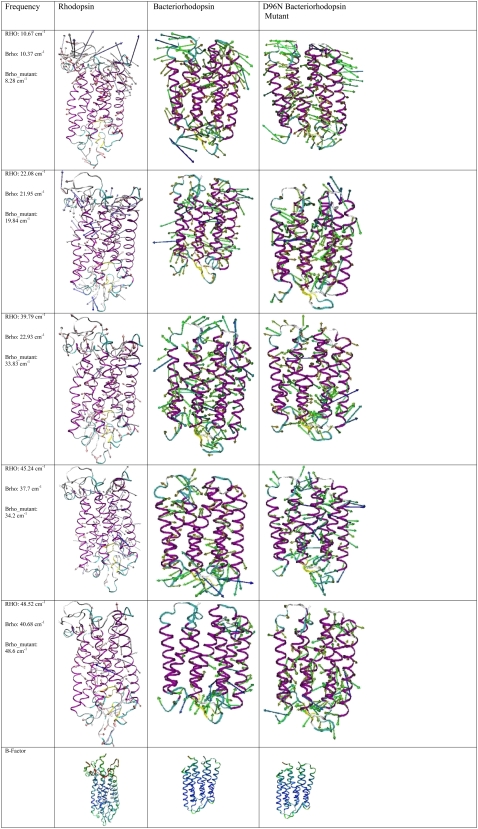
We studied the low-frequency terahertz spectroscopy of two photoactive protein systems, rhodopsin and bacteriorhodopsin, as a means to characterize collective low-frequency motions in helical transmembrane proteins. From this work, we found that the nature of the vibrational motions activated by terahertz radiation is surprisingly similar between these two structurally similar proteins. Specifically, at the lowest frequencies probed, the cytoplasmic loop regions of the proteins are highly active; and at the higher terahertz frequencies studied, the extracellular loop regions of the protein systems become vibrationally activated. In the case of bacteriorhodopsin, the calculated terahertz spectra are compared with the experimental terahertz signature. This work illustrates the importance of terahertz spectroscopy to identify vibrational degrees of freedom which correlate to known conformational changes in these proteins.
Figures
Similar articles
-
Protein flexibility and conformational state: a comparison of collective vibrational modes of wild-type and D96N bacteriorhodopsin.Biophys J. 2003 Aug;85(2):1269-77. doi: 10.1016/S0006-3495(03)74562-7. Biophys J. 2003. PMID: 12885670 Free PMC article.
-
Conformations of the rhodopsin third cytoplasmic loop grafted onto bacteriorhodopsin.Structure. 2000 Jun 15;8(6):643-53. doi: 10.1016/s0969-2126(00)00151-9. Structure. 2000. PMID: 10873864
-
Low-frequency vibrational modes and infrared absorbance of red, blue and green opsin.J Mol Model. 2009 Aug;15(8):959-69. doi: 10.1007/s00894-008-0446-1. Epub 2009 Feb 3. J Mol Model. 2009. PMID: 19189139
-
Reaction-induced infrared difference spectroscopy for the study of protein function and reaction mechanisms.Trends Biochem Sci. 1993 Jun;18(6):197-202. doi: 10.1016/0968-0004(93)90186-q. Trends Biochem Sci. 1993. PMID: 8346552 Review.
-
Structure of rhodopsin.Novartis Found Symp. 1999;224:54-66; discussion 66-9,. Novartis Found Symp. 1999. PMID: 10614046 Review.
Cited by
-
Vibrational resonance, allostery, and activation in rhodopsin-like G protein-coupled receptors.Sci Rep. 2016 Nov 16;6:37290. doi: 10.1038/srep37290. Sci Rep. 2016. PMID: 27849063 Free PMC article.
-
Rhodopsin: the functional significance of asn-linked glycosylation and other post-translational modifications.Ophthalmic Genet. 2009 Sep;30(3):109-20. doi: 10.1080/13816810902962405. Ophthalmic Genet. 2009. PMID: 19941415 Free PMC article. Review.
-
Terahertz-infrared spectroscopy of Shewanella oneidensis MR-1 extracellular matrix.J Biol Phys. 2018 Sep;44(3):401-417. doi: 10.1007/s10867-018-9497-4. Epub 2018 May 7. J Biol Phys. 2018. PMID: 29732506 Free PMC article.
-
Terahertz Spectroscopy and Imaging: A Cutting-Edge Method for Diagnosing Digestive Cancers.Materials (Basel). 2019 May 9;12(9):1519. doi: 10.3390/ma12091519. Materials (Basel). 2019. PMID: 31075912 Free PMC article. Review.
-
Epithelial Sodium Channel Inhibition by Amiloride Addressed with THz Spectroscopy and Molecular Modeling.Molecules. 2022 May 19;27(10):3271. doi: 10.3390/molecules27103271. Molecules. 2022. PMID: 35630748 Free PMC article.
References
-
- Tama, F., and Y.-H. Sanejouand. 2001. Conformational change of proteins arising from normal mode calculations. Protein Eng. 14:1–6. - PubMed
-
- Markelz, A. G., A. Roitberg, and E. J. Heilweil. 2000. Pulsed terahertz spectroscopy of DNA, bovine serum albumin and collagen between 0.1 and 2.0 THz. Chem. Phys. Lett. 320:42–48.
-
- Tama, F., F. X. Gadea, O. Marques, and Y.-H. Sanejouand. 2000. Building-block approach for determining low-frequency normal modes of macromolecules. Proteins. 41:1–7. - PubMed
Publication types
MeSH terms
Substances
LinkOut - more resources
Full Text Sources
