. 2008 Apr 15;94(8):3273-85.
doi: 10.1529/biophysj.106.099333. Epub 2008 Jan 16.

Changes in the hyperelastic properties of endothelial cells induced by tumor necrosis factor-alpha

Affiliations

Changes in the hyperelastic properties of endothelial cells induced by tumor necrosis factor-alpha

Inkyung Kang et al. Biophys J. .

Abstract

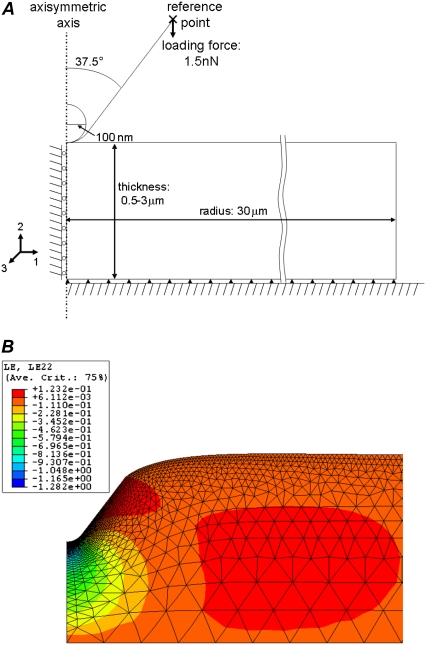
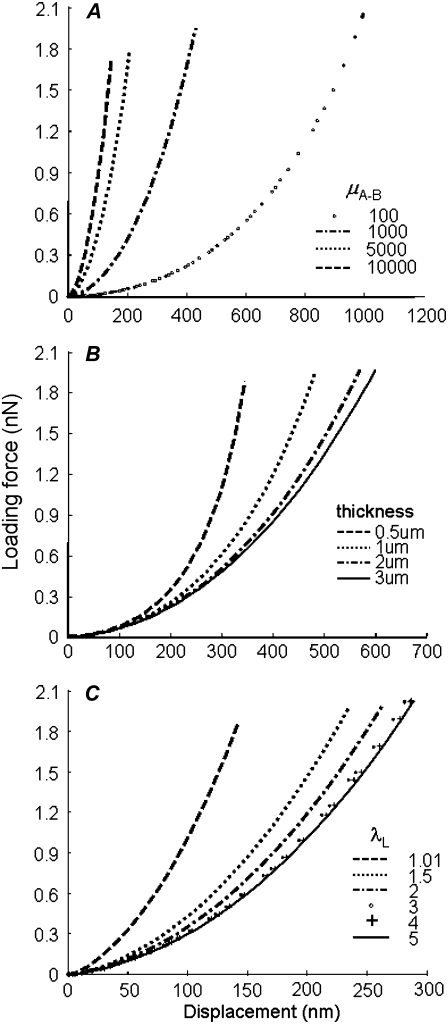
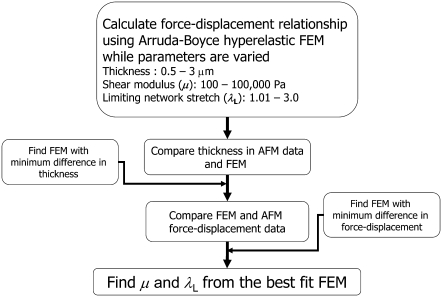
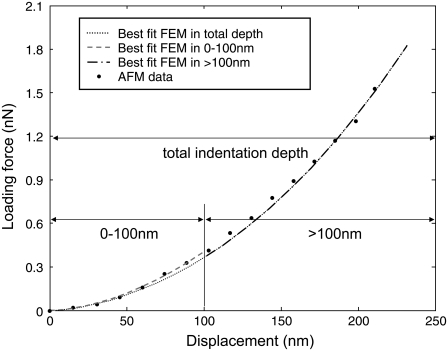
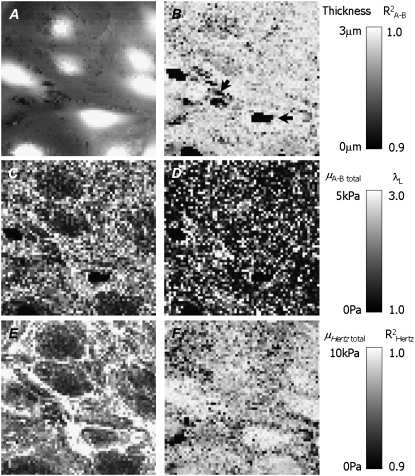
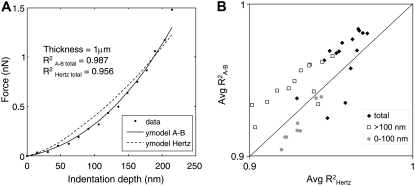
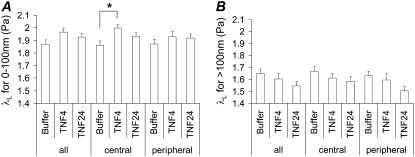
Mechanical properties of living cells can be determined using atomic force microscopy (AFM). In this study, a novel analysis was developed to determine the mechanical properties of adherent monolayers of pulmonary microvascular endothelial cells (ECs) using AFM and finite element modeling, which considers both the finite thickness of ECs and their nonlinear elastic properties, as well as the large strain induced by AFM. Comparison of this model with the more traditional Hertzian model, which assumes linear elastic behavior, small strains, and infinite cell thickness, suggests that the new analysis can predict the mechanical response of ECs during AFM indentation better than Hertz's model, especially when using force-displacement data obtained from large indentations (>100 nm). The shear moduli and distensibility of ECs were greater when using small indentations (<100 nm) compared to large indentations (>100 nm). Tumor necrosis factor-alpha induced changes in the mechanical properties of ECs, which included a decrease in the average shear moduli that occurred in all regions of the ECs and an increase in distensibility in the central regions when measured using small indentations. These changes can be modeled as changes in a chain network structure within the ECs.


Figures

FIGURE 1
FIGURE 1
The computational stress-stretch curve (A) and the elastic moduli determined as the initial slope of the stress-stretch curve (B) during uniaxial stretch determined using the eight-chain model and Hooke's law when μ8chain and μHooke are = 1 Pa. (A) Stress-stretch curves exhibited greater strain-hardening behavior upon decreasing λL (distensibility) in contrast to the linear relationship predicted by Hooke's law. (B) The elastic moduli from Arruda-Boyce model and from Hooke's model (E(8chain) and E(Hooke)) are calculated as the initial slope of the stress-stretch curve in panel A when stretch = 1. When the distensibility is large, E(8chain) is similar to E(Hooke), but increases rapidly as the distensibility decreases toward unity.
FIGURE 2
FIGURE 2
Finite element models of AFM indentation on thin adherent cells. (A) The contact between the AFM probe and a confluent layer of thin adherent cells was modeled as an axisymmetric compression by a rigid blunt-conical indenter with tip radius of 100 nm and half-open angle of 37.5° on a thin layer by using Abaqus 6.4.1. The three axes of the configuration are depicted as 1, 2, and 3 along with the direction of the axes. (B) Strain field in the thin adherent layer of cells during AFM indentation computed by FEM. Strain in perpendicular direction (LE22) reached up to ∼130% in the elements under the center of the probe, indicating that the regions near this element suffered large strain during AFM indentation.
FIGURE 3
FIGURE 3
FEM force-displacement data during AFM indentation. (A) Force-displacement curves upon varying shear moduli from 100 to 10,000 Pa with fixed values of λL at 1.05 and thickness at 2 μm. (B) Force-displacement curves upon varying the thickness from 0.5 to 3 μm with fixed values of λL at 1.05 and μ8chain at 500 Pa. The force increased at the same value of displacement when the thickness decreased, especially in the range of <1 μm. (C) Force-displacement upon varying λL from 1.01 to 5 with fixed μ8chain at 5000 Pa and thickness at 2 μm. Decreased distensibility of the polymer chain network (λL) within the material resulted in increased force at the same displacement.
FIGURE 4
FIGURE 4
Flow diagram of the parametric approach for determining the mechanical properties using finite element analysis. A database of computational force-displacement curves was generated using parameters varying between 0.5 and 3 μm for the thickness, 1.01–3 for the distensibility, and 100–100,000 Pa for the shear moduli in the eight-chain hyperelastic FEMs. For each combination of the thickness and shear modulus parameters, AFM indentation on the cell was simulated while recording the magnitude of total force (TF:magnitude) and displacement in axis 2 (U2) at the reference point of the rigid indenter. The thickness of the EC region at which the AFM data was determined and compared with the thickness used in all FEMs. A subset of FEMs with the closest thickness was selected. AFM force-displacement data were then compared with the force-displacement data from the subset of FEMs, and the mechanical properties were determined from the shear modulus and distensibility of the best fit FEMs.
FIGURE 5
FIGURE 5
Determining mechanical properties from AFM force-displacement data measured on ECs using FEM. The thickness of EC at which AFM data was obtained was determined from the height in the AFM topography image and the indentation depth in the force-displacement data. The force-displacement data were divided according to the indentation depth of 0–100 nm, >100 nm, and in the total indentation depth. The mechanical properties in these indentation depths were determined from the best-fit FEMs that simulate the experimental force-displacement curve most closely.
FIGURE 6
FIGURE 6
Maps of thickness (A), formula image (B), μ8chain total (C), λL (D), EHertz total (E), and formula image (F) of a representative region of EC monolayers. Scale bars in the right represent the range of the values of thickness, formula image μ8chain, λL, EHertz total, and formula image in each map. Regions near nuclei with thickness >3 μm or near cell junctions with thickness <0.5 μm correspond to dark areas in formula image map (solid arrows in B), because the thickness of these regions falls out of the range used in the FEMs.
FIGURE 7
FIGURE 7
The fit of the eight-chain model and Hertz's model to the AFM force-displacement data. (A) A representative example shows that the eight-chain model mimicked experimental force-displacement data closer than Hertz's model, as indicated by the greater R2 value. (B) formula image and formula image averaged for entire area of each EC when using the eight-chain model or Hertz's model for the entire indentation depths, and for 0–100 nm and >100 nm indentations are shown.
FIGURE 8
FIGURE 8
The average shear moduli (A) and distensibility (B) for 0–100 nm and >100 nm of indentation depths for the entire surface, peripheral, and central regions from the FEMs and the average μ8chain 0-100nm and μ8chain>100nm from Hertz's model (C). The values μ8chain 0-100nm were ≫μ8chain>100nm in the entire surface, peripheral, and central regions of the ECs when analyzed using FEM (#-columns in panel A, P < 0.05). The value λL was significantly greater in the indentation depths 0–100 nm than in the depths >100 nm (#-columns in panel B, P < 0.05). When Hertz's model was used in the analysis, μHertz 0–100nm were not significantly different from μHertz > 100nm in any region of the cells.
FIGURE 9
FIGURE 9
Representative confocal laser scanning microscopy images of the ECs stained against F-actin (green) and nuclei (blue) after 0 (A), 4 (B), and 24 (C) h of TNF-α treatment. (A) Most F-actin was in peripheral bands near intercellular junctions before TNF-α treatment. (B) After 4 h of TNF-α treatment, the peripheral bands were disrupted, and more F-actin stress fibers were observed in the central region of the ECs. (C) After 24 h of TNF-α treatment, ECs were elongated in shape and F-actin stress fibers were increased. Scale bar = 50 μm.
FIGURE 10
FIGURE 10
The average values of μ8chain 0-100nm, μ8chain>100nm, μHertz 0-100nm, and μHertz>100nm (A–D) for the entire surface, for the central and peripheral regions of ECs before and after TNF-α treatment for 4 and 24 h. (A) The average μ8chain 0-100nm values of ECs were significantly lower than controls after 4 and 24 h of TNF-α treatment in the entire EC surface and in the central and peripheral regions (P < 0.05). (B) The average μ8chain>100nm values exhibited similar changes for the entire EC surface and in the central and peripheral regions after 24 h of TNF-α treatment (P < 0.05). (C) The average μHertz 0-100nm values for the entire EC surface and for the central regions were significantly lower than controls after 4 and 24 h of TNF-α treatment (P < 0.05). (D) The values of μHertz>100nm tended to decrease, but not significantly.
FIGURE 11
FIGURE 11
The average λL values for (A) 0–100 nm and (B) >100 nm of indentation depths for the entire surface and for the central and peripheral regions of ECs before and after TNF-α treatment for 4 and 24 h. (A) The average λL value for 0–100 nm in the central region was significantly greater than controls after 4 h of TNF-α treatment (P < 0.05). (B) The λL-value for >100 nm tended to be lower than controls after 24 h of TNF-α treatment, but not significantly.

Similar articles

Cited by

References

    1. Tajaddini, A., D. L. Kilpatrick, and D. G. Vince. 2003. A novel experimental method to estimate stress-strain behavior of intact coronary arteries using intravascular ultrasound (IVUS). J. Biomech. Eng. 125:120–123. - PubMed
    1. Kilpatrick, D., C. Xu, R. Vito, and S. Glagov. 2002. Correlation of mechanical behavior and MMP-1 presence in human atherosclerotic plaque. J. Mech. Med. Biol. 2:1–7.
    1. Samani, A., and D. Plewes. 2004. A method to measure the hyperelastic parameters of ex vivo breast tissue samples. Phys. Med. Biol. 49:4395–4405. - PubMed
    1. Krouskop, T. A., T. M. Wheeler, F. Kallel, B. S. Garra, and T. Hall. 1998. Elastic moduli of breast and prostate tissues under compression. Ultrason. Imaging. 20:260–274. - PubMed
    1. Marchant, R. E., I. Kang, P. S. Sit, Y. Zhou, B. A. Todd, S. J. Eppell, and I. Lee. 2002. Molecular views and measurements of hemostatic processes using atomic force microscopy. Curr. Protein Pept. Sci. 3:249–274. - PubMed

Publication types

MeSH terms

Substances

LinkOut - more resources