. 2008 Jun;94(11):4370-82.
doi: 10.1529/biophysj.106.091652. Epub 2008 Jan 16.

Femtosecond kinetics of photoconversion of the higher plant photoreceptor phytochrome carrying native and modified chromophores

Affiliations

Femtosecond kinetics of photoconversion of the higher plant photoreceptor phytochrome carrying native and modified chromophores

Marc G Müller et al. Biophys J. 2008 Jun.

Abstract

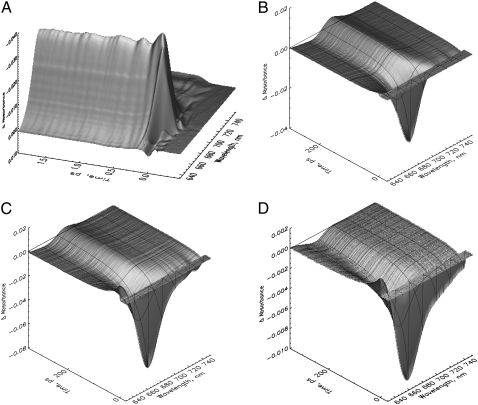
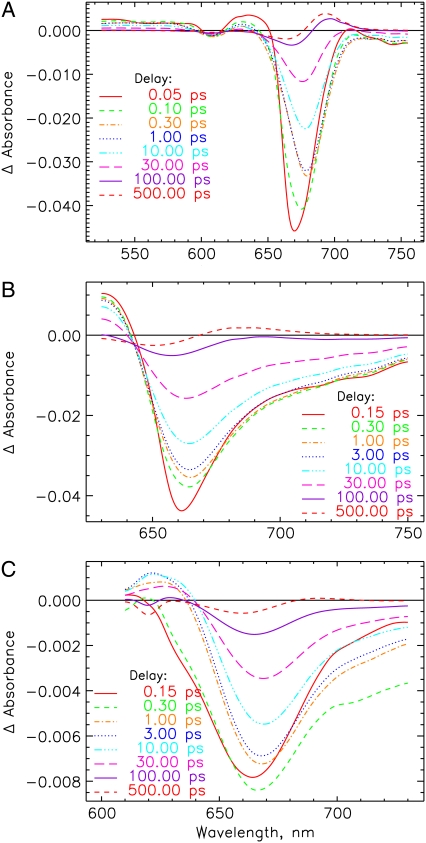
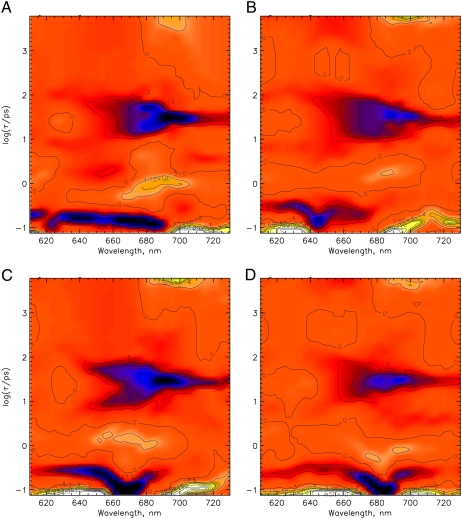
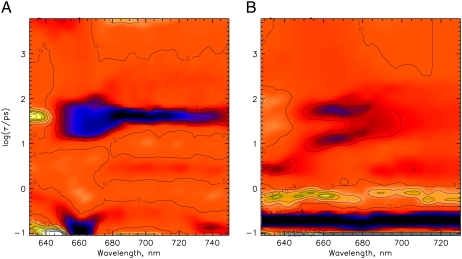
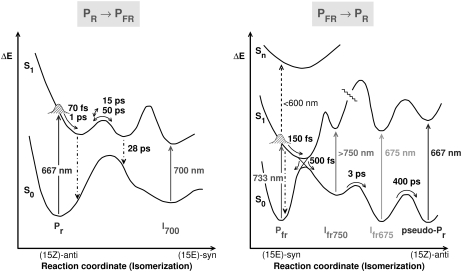
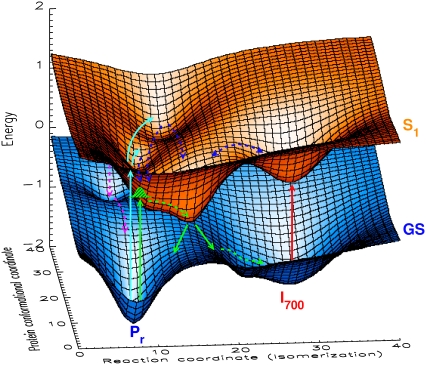
The photoprocesses of native (phyA of oat), and of C-terminally truncated recombinant phytochromes, assembled instead of the native phytochromobilin with phycocyanobilin (PCB-65 kDa-phy) and iso-phycocyanobilin (iso-PCB-65 kDa-phy) chromophores, have been studied by femtosecond transient absorption spectroscopy in both their red absorbing phytochrome (P(r)) and far-red absorbing phytochrome (P(fr)) forms. Native P(r) phytochrome shows an excitation wavelength dependence of the kinetics with three main picosecond components. The formation kinetics of the first ground-state intermediate I(700), absorbing at approximately 690 nm, is mainly described by 28 ps or 40 ps components in native and PCB phytochrome, respectively, whereas additional approximately 15 and 50 ps components describe conformational dynamics and equilibria among different local minima on the excited-state hypersurface. No significant amount of I(700) formation can be observed on our timescale for iso-PCB phytochrome. We suggest that iso-PCB-65 kDa-phy either interacts with the protein differently leading to a more twisted and/or less protonated configuration, or undergoes P(r) to P(fr) isomerization primarily via a different configurational pathway, largely circumventing I(700) as an intermediate. The isomerization process is accompanied by strong coherent oscillations due to wavepacket motion on the excited-state surface for both phytochrome forms. The femto- to (sub-)nanosecond kinetics of the P(fr) forms is again quite similar for the native and the PCB phytochromes. After an ultrafast excited-state relaxation within approximately 150 fs, the chromophores return to the first ground-state intermediate in 400-800 fs followed by two additional ground-state intermediates which are formed with 2-3 ps and approximately 400 ps lifetimes. We call the first ground-state intermediate in native phytochrome I(fr 750), due to its pronounced absorption at that wavelength. The other intermediates are termed I(fr 675) and pseudo-P(r). The absorption spectrum of the latter already closely resembles the absorption of the P(r) chromophore. PCB-65 kDa-phy shows a very similar kinetics, although many of the detailed spectral features in the transients seen in native phy are blurred, presumably due to wider inhomogeneous distribution of the chromophore conformation. Iso-PCB-65 kDa-phy shows similar features to the PCB-65 kDa-phy, with some additional blue-shift of the transient spectra of approximately 10 nm. The sub-200 fs component is, however, absent, and the picosecond lifetimes are somewhat longer than in 124 kDa phytochrome or in PCB-65 kDa-phy. We interpret the data within the framework of two- and three-dimensional potential energy surface diagrams for the photoisomerization processes and the ground-state intermediates involved in the two photoconversions.


Figures

FIGURE 1
FIGURE 1
Original femtosecond to (sub-)nanosecond transient absorption kinetics of three different types of phytochrome in their Pr forms in a three-dimensional surface presentation (A and B). Native phytochrome on two different timescales excited at 665 nm (note the inversed absorption scale in A). (C) PCB-65 kDa-phy and (D) iso-PCB-65 kDa-phy, both excited at 660 nm. The black lines indicate some selected transient decays.
FIGURE 2
FIGURE 2
Transient absorption spectra after deconvolution and chirp correction at selected delay times of the Pr forms of (A) 124 kDa phytochrome (native phyA), excited at 665 nm. (B) PCB-65 kDa-phy and (C) iso-PCB-65 kDa-phy, excited at 660 and 620 nm, respectively. Note that these transient spectra have been recalculated from the lifetime density maps (Fig. 3). They do not contain the oscillatory contributions, which are rather found in the residuals of the analyses (see below).
FIGURE 3
FIGURE 3
The lifetime density maps showing the excitation wavelength dependence of the femto- to nanosecond kinetics for native phyA in its Pr form. Excitation wavelengths are 620 nm (A), 640 nm (B), 665 nm (C), and 685 nm (D). Dark-blue color indicates negative and green/yellow-white positive amplitudes of a lifetime component while orange color reflects the zero level. The lifetime range is drawn on a logarithmic scale and extends from ∼100 fs to ∼6 ns (see Materials and Methods).
FIGURE 4
FIGURE 4
Femto- to nanosecond kinetics represented as lifetime density maps for (A) PCB-65 kDa-phy excited at 660 nm and (B) iso-PCB-65 kDa-phy excited at 620 nm in their Pr forms. For a description of the color coding see Fig. 3.
FIGURE 5
FIGURE 5
Transient absorption kinetics of native phyA excited at 733 nm in the Pfr form in a three-dimensional surface representation.
FIGURE 6
FIGURE 6
Transient absorption spectra at selected delay times for the Pfr forms of (A) native phyA excited at 733 nm and (B) PCB-65 kDa-phy excited at 715 nm. See note in Fig. 2 legend.
FIGURE 7
FIGURE 7
Lifetime density maps for the Pfr forms of (A) native phyA excited at 733 nm, and (B) PCB-65 kDa-phy, and (C) iso-PCB-65 kDa-phy, both excited at 715 nm. At these wavelengths the remaining Pr forms after phototransformation are not excited. For a description of the color coding see Fig. 3. (C) Lifetime range below ∼200 fs has not been included in the analysis because of problems with the coherent solvent dynamics.
FIGURE 8
FIGURE 8
Two-dimensional reaction coordinate models for the phototransformations of native phyA from Pr to Pfr (left) and back from Pfr to Pr (right). The absorption maxima of ground state and intermediates are shown as vertical arrows. The lifetimes of the major reaction steps are also given and are also indicated by arrows.
FIGURE 9
FIGURE 9
Cartoon showing a three-dimensional presentation of the excited (S1) and ground state (GS) potential energy surfaces for the Pr to Pfr phototransformation of native phyA. The S1 potential surface of Pr has several potential minima which are separated by low barriers and can be reached after photoexcitation. The model separates the reaction coordinate for chromophore isomerization from the perpendicular reaction coordinate(s) of the protein/chromophore conformations not leading to isomerization. The green arrows indicate the excitation into a state with low excess energy and direct relaxation into the active channel leading to I700. The green shaded Gaussian (reached by the green upward arrow from Pr) indicates the initially created wavepacket in the excited state. The light blue arrows shows excitation into states with higher excess energy. The dark blue arrows show movements on the excited-state potential surface—involving chromophore and protein modes—leading out of nonreactive or less reactive channels (potential minima). The red arrow indicates excitation of I700 into an excited-state surface common to I700 and Pr. The purple arrows indicate internal conversion from nonreactive potential minima back to the Pr ground state (for further discussion see text). Note that the detailed form of these potential energy surfaces should not be taken literally. The figure merely serves to illustrate the principal properties of the dynamics in the excited state and the interpretation of parallel and/or alternative processes.

References

    1. Batschauer, A. 1998. Photoreceptors of higher plants. Planta. 206:479–492. - PubMed
    1. Gärtner, W., and S. E. Braslavsky. 2004. The phytochromes: spectroscopy and function. In Photoreceptors and Light Signaling. A. Batschauer, editor. Royal Society of Chemistry, Cambridge, UK.
    1. Moller, S. G., P. J. Ingles, and G. C. Whitelam. 2002. The cell biology of phytochrome signaling. New Phytol. 154:553–590. - PubMed
    1. Kevei, E., and F. Nagy. 2003. Phytochrome controlled signaling cascades in higher plants. Physiol. Plant. 117:305–313. - PubMed
    1. Hughes, J., T. Lamparter, F. Mittmann, E. Hartmann, W. Gärtner, A. Wilde, and T. Börner. 1997. A prokaryotic phytochrome. Nature. 386:663. - PubMed

MeSH terms

Substances