. 2008 Apr 15;94(8):3286-92.
doi: 10.1529/biophysj.107.119099. Epub 2008 Jan 16.

T cell receptor microcluster transport through molecular mazes reveals mechanism of translocation

Affiliations

T cell receptor microcluster transport through molecular mazes reveals mechanism of translocation

Andrew L DeMond et al. Biophys J. .

Abstract

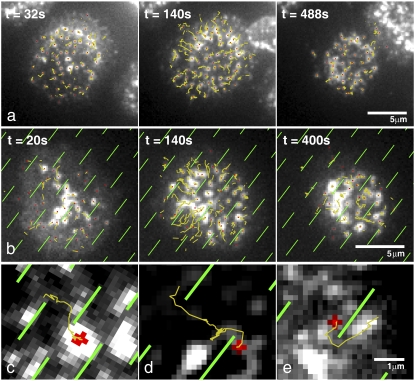
Recognition of peptide antigen by T cells involves coordinated movement of T cell receptors (TCRs) along with other costimulatory and signaling molecules. The spatially organized configurations that result are collectively referred to as the immunological synapse. Experimental investigation of the role of spatial organization in TCR signaling has been facilitated by the use of nanopatterned-supported membranes to direct TCR into alternative patterns. Here we study the mechanism by which substrate structures redirect TCR transport. Using a flow-tracking algorithm, the ensemble of TCR clusters within each cell was tracked during synapse formation under various constraint geometries. Shortly after initial cluster formation, a coordinated centripetal flow of approximately 20 nm/s develops. Clusters that encounter substrate-imposed constraint are deflected and move parallel to the constraint at speeds that scale with the relative angle of motion to the preferred centripetal direction. TCR transport is driven by actin polymerization, and the distribution of F-actin was imaged at various time points during the synapse formation process. At early time points, there is no significant effect on actin distribution produced by substrate constraints. At later time points, modest differences were observed. These data are consistent with a frictional model of TCR coupling to cytoskeletal flow, which allows slip. Implications of this model regarding spatial sorting of cell-surface molecules are discussed.


Figures

FIGURE 1
FIGURE 1
Experimental schematic. (a) Lipid bilayers displaying mobile pMHC and ICAM-1 are formed on substrates patterned with molecular mazes. Mazes comprise 100 nm thick, 5.5nm high chrome features, with 1.5–2 μm long lines separated by 1.5–2 μm gaps; alternating lines are spaced 1.5–2 μm apart. Synapse formation was imaged by total internal reflection fluorescence microscopy, restricting the illumination to a 100 nm layer above the coverslip. TCR is labeled with a fluorescently tagged antibody fragment. Maze experiments were designed to elucidate the mechanism of synaptic repatterning by nanofabricated constraints such as in b and c. TCR microcluster formation at early time points (b) is not altered by constraints on the substrate, but at late time points TCR microclusters are reorganized and trapped on the side of the constraint nearest the cell center (marked with a red ×). Mazes permit the visualization of TCR-constraint interaction without irreversible trapping of the TCR in grid corners.
FIGURE 2
FIGURE 2
Molecular mazes redirect TCR motion. (a) A T cell forming an immunological synapse on an unpatterned bilayer. Initial contact with the bilayer induces T cell receptor TCR clustering across the face of the cell, which is followed by a contraction phase. After contraction, a relatively stationary phase occurs where large clusters are fixed and subthreshold clusters continue to stream in from the periphery. At the acquisition rate required for particle tracking, cells typically don't form strong central accumulations of TCR because fluorescent tags are bleached during transport. Formation of central TCR accumulations was confirmed by visualizing cells just out of the tracking region of interest. Track lines are truncated at 15 frames previous to the frame shown. (b) Synapse formation on a supported lipid bilayer patterned with chromium fences (fences are outlined in green to aid the eye). The motion of TCR clusters is diverted by underlying chromium features. Clusters can sometimes be trapped by bilayer defects and not make it to the center, such as at 8 o'clock and 2 o'clock in this cell. (ce)Example tracks show the effect of barriers on TCR translocation. The final position of the object is shown in red. For videos, see the Supplementary Material.
FIGURE 3
FIGURE 3
Mean velocity and intensity of microclusters in a typical cell. After the T cell contacts the bilayer, there is an initial period of rapid microcluster nucleation and growth with negligible microcluster movement (light gray). After ∼30s, there is a period of rapid contraction during which TCRs translocate to the cell center (dark gray), followed by a relatively stationary mature phase (medium gray). TCR microcluster radial velocities from ∼50 microclusters in a single cell were averaged across each frame (dashed), then smoothed with a 5 frame windowed average (solid). Mean microcluster intensity in each frame was computed by summing the intensity of the pixels in each microcluster and averaging over clusters. Microclusters initiate movement only after the spreading process has stopped, suggesting that centripetal cortical actin flow begins only after spreading is completed. These observations are recapitulated in analyses of individual tracks (see Fig. S1).
FIGURE 4
FIGURE 4
TCR clusters are slowed by maze features. (A) In each frame, TCR microclusters within 500 nm of a fence line opposite the cell center were automatically selected (positions shown in red). Tracks to which these fence-associated clusters belonged were then selected; cluster positions from full-length tracks are shown in green. All TCR microcluster positions from the entire movie are shown in blue. (B) The fence-associated tracks are shown in line form, colored cyan when within 500 nm of a fence line and yellow when outside 500 nm. Red dots indicate the end of a track. (C) Microclusters are slowed by grids. Microcluster speeds for fence-associated and free intervals were calculated for each track and averaged for each cell. Bars show mean and standard deviation of cell means (n = 7, p < .001). (D) The speed distribution of free and maze-associated particles. (E) Speed slow-down is angle dependent. Clusters that encounter perpendicular maze features do not cross over and diffuse along the obstacle. Clusters encountering maze features at an angle to the preferred centripetal flow slow down. This slowing is geometrical, rather than drag-related, as clusters moving parallel to maze features are not significantly slowed. Bars represent mean and standard deviation of at least three tracks (pperpendicular = 0.009, pacute = 0.0003, pparallel = 0.8).
FIGURE 5
FIGURE 5
Actin localization on gridded substrates. T cells labeled with red anti-TCR antibodies were stimulated with plain and gridded bilayers and fixed at the indicated time points. Grids were used instead of maze substrates because they reveal the integrated effect of altered TCR mobility on actin patterns by fixing the TCR in a defined location. Fixed cells were stained for F-actin with FITC-phalloidin and imaged by dual-color total internal reflection microscopy, restricting the illumination volume to a 200 nm thick layer above the glass-water interface. Ten pixel wide line scans across the synaptic face were averaged across cells to determine the distribution of F-actin. (A and B) On both nongridded and gridded substrates, T cells in the immature synapse phase display a distal ring-shaped accumulation of F-actin associated with cell spreading (29) (A, n = 20; B, n = 17). TCR clusters in the nongridded cell have formed but not yet coalesced into a central accumulation. In the gridded substrate, TCR has not yet fully localized to the centripetal corners of grid squares, and some grid squares have multiple clusters of TCR. (C) T cells that have formed a mature synapse display a central accumulation of F-actin that colocalizes with TCR. This central accumulation is surrounded by a ring of lamellipodial F-actin (n = 36). (D) Cells synapsing on gridded substrates have a flatter distribution of F-actin across the cell face, but on average display a vestige of the central accumulation surrounded by a lamellipodial ring (n = 27) found in cells on ungridded substrates. No significant accumulation of F-actin at grid lines is visible.
FIGURE 6
FIGURE 6
Frictional model of the mechanism of TCR translocation. Clusters of TCR containing hundreds of monomers are propelled by transient linkage to a prevailing centripetal actin flow. Even if the link between individual TCRs and actin is very weak, clusters of TCR are still, on average, linked to the cytoskeleton.

References

    1. Akins, M. R., and T. Biederer. 2006. Cell-cell interactions in synaptogenesis. Curr. Opin. Neurobiol. 16:83–89. - PubMed
    1. Krummel, M. F., and I. Macara. 2006. Maintenance and modulation of T cell polarity. Nat. Immunol. 7:1143–1149. - PubMed
    1. Grakoui, A., S. K. Bromley, C. Sumen, M. M. Davis, A. S. Shaw, P. M. Allen, and M. L. Dustin. 1999. The immunological synapse: A molecular machine controlling T cell activation. Science. 285:221–227. - PubMed
    1. Moss, W. C., D. J. Irvine, M. M. Davis, and M. F. Krummel. 2002. Quantifying signaling-induced reorientation of T cell receptors during immunological synapse formation. Proc. Natl. Acad. Sci. USA. 99:15024–15029. - PMC - PubMed
    1. Krummel, M. F., M. D. Sjaastad, C. Wulfing, and M. M. Davis. 2000. Differential clustering of CD4 and CD3 zeta during T cell recognition. Science. 289:1349–1352. - PubMed

Publication types

Substances

LinkOut - more resources