. 2008 Mar;19(3):1139-51.
doi: 10.1091/mbc.e07-09-0881. Epub 2008 Jan 16.

Phosphorylation by c-Jun NH2-terminal kinase 1 regulates the stability of transcription factor Sp1 during mitosis

Affiliations

Phosphorylation by c-Jun NH2-terminal kinase 1 regulates the stability of transcription factor Sp1 during mitosis

Jian-Ying Chuang et al. Mol Biol Cell. 2008 Mar.

Abstract

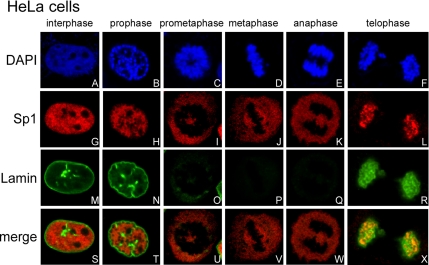
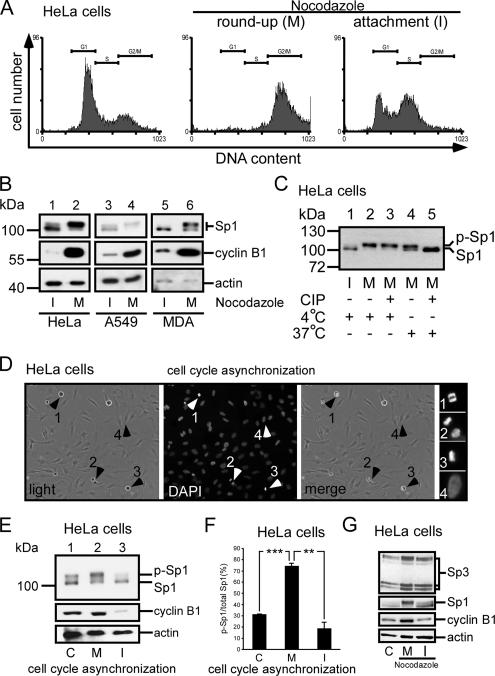
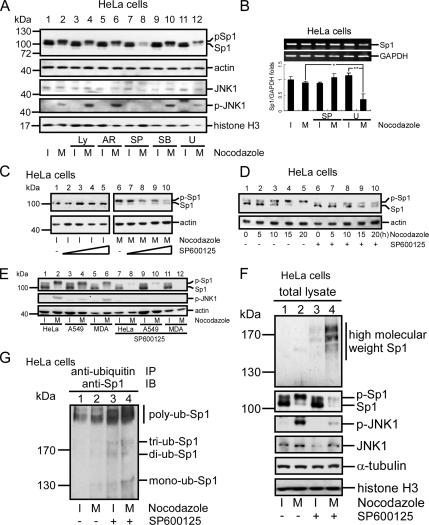
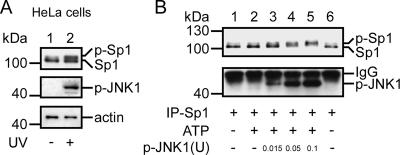
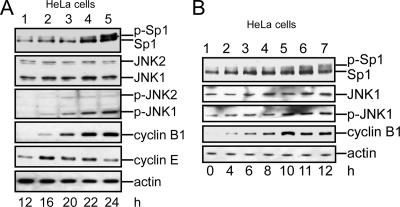
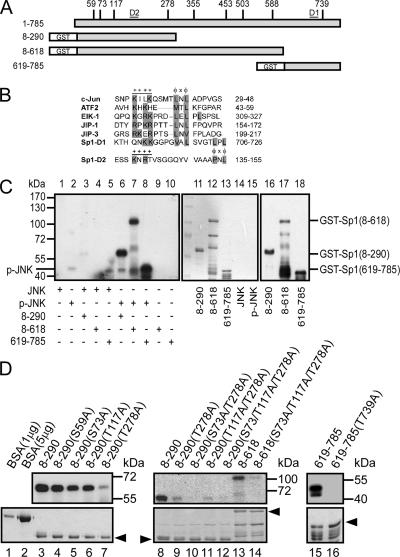
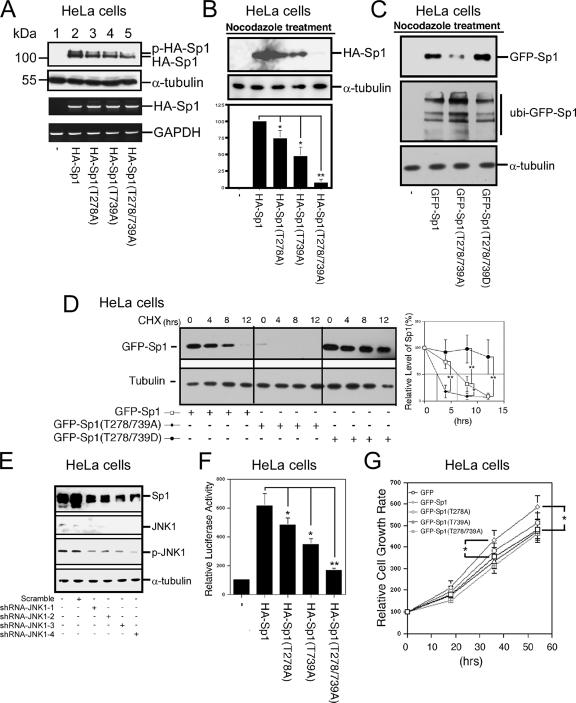
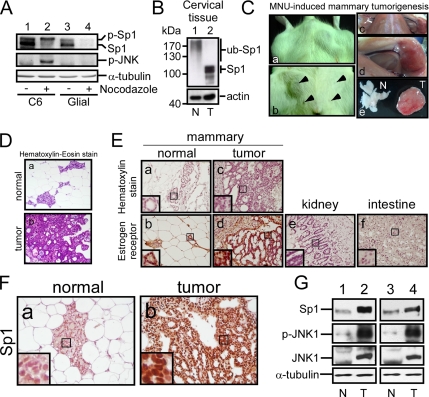
The transcription factor Sp1 is ubiquitously expressed in different cells and thereby regulates the expression of genes involved in many cellular processes. This study reveals that Sp1 was phosphorylated during the mitotic stage in three epithelial tumor cell lines and one glioma cell line. By using different kinase inhibitors, we found that during mitosis in HeLa cells, the c-Jun NH(2)-terminal kinase (JNK) 1 was activated that was then required for the phosphorylation of Sp1. In addition, blockade of the Sp1 phosphorylation via inhibition JNK1 activity in mitosis resulted in the ubiquitination and degradation of Sp1. JNK1 phosphorylated Sp1 at Thr278/739. The Sp1 mutated at Thr278/739 was unstable during mitosis, possessing less transcriptional activity for the 12(S)-lipoxygenase expression and exhibiting a decreased cell growth rate compared with wild-type Sp1 in HeLa cells. In N-methyl-N-nitrosourea-induced mammary tumors, JNK1 activation provided a potential relevance with the accumulation of Sp1. Together, our results indicate that JNK1 activation is necessary to phosphorylate Sp1 and to shield Sp1 from the ubiquitin-dependent degradation pathway during mitosis in tumor cell lines.


Figures

Figure 1.
Figure 1.
Distribution of Sp1 during the cell cycle. HeLa cells were grown on coverslips in DMEM, fixed using 4% paraformaldehyde, double-labeled with rabbit anti-Sp1 antibodies (G–L) and mouse anti-lamin A/C antibodies (M–R), and then stained with secondary antibodies conjugated with FITC or Cy5, respectively. DNA was stained with DAPI (A–F). Finally, the cells were examined using a confocal laser scanning microscope.
Figure 2.
Figure 2.
Sp1 was highly phosphorylated during the mitotic stage. HeLa cells were treated with 45 ng/ml nocodazole for 16 h, and then they were divided into two parts: round-up and attachment cells. To check the stage of the cell cycle, samples were taken for FACS and Western blot analysis. (A) FACS results of paraformaldehyde-fixed, propidium iodide-stained cells are shown as histograms, and the positions of the G1 phase peak, S phase, and G2/M phase peak are marked by horizontal lines. For comparison, untreated HeLa cells were used (left). (B) Immunoblots of cellular extracts of HeLa, A549 and MDA-MB-231 cells in attachment (interphase, I) and round-up (mitotic stage, M) cells were probed using anti-Sp1 antibodies. Cyclin B1 detected by using anti-cyclin B1 antibodies was used as M phase marker, and actin was used as an equal loading control. (C) Mitotic cell extracts were treated with alkaline phosphatase (CIP) to dephosphorylate Sp1, and incubated at 37°C. For comparison, alkaline phosphatase at 4°C has no enzyme activity to dephosphorylate Sp1. The samples were then analyzed using immunoblotting with anti-Sp1 antibodies. (D) In the normal cultured HeLa cells, the round-up and attached cells were separated, and the cell cycle stage was then checked by DAPI. The arrows 1–3 represent that cells stayed in mitosis stage, and arrow 4 represents that cells stayed in interphase. (E). Equal cell number from mixture (control total cells, lane 1), mitosis (round-up cells, lane 2) and interphase (attachment cells, lane 3) stages was used to detect the Sp1 phosphorylated level by using immunoblot of anti-Sp1 antibodies. (F) After three independent experiments, the level of Sp1 phosphorylation was quantified. Only statistically significant p values are shown (**p < 0.01 and ***p < 0.001). (G) Cells in interphase and mitotic stages synchronized by nocodazole (lanes 2 and 3) or control HeLa cells (lane 1) were pooled, and the cellular extracts were then probed using anti-Sp3 antibodies. Sp1 detected by using anti-Sp1 antibodies was used as a positive control, cyclin B1 as an M phase marker and actin as an equal loading control.
Figure 3.
Figure 3.
JNK1 activation in mitosis was important for Sp1 stabilization. HeLa cells were treated with 45 ng/ml nocodazole or cotreated with various kinase inhibitors: Ly294002 (Ly) (inhibits PI3K), AR-A014418 (AR) (inhibits GSK), SP600125 (SP) (inhibits JNK), SB203580 (SB) (inhibits P38), and U0126 (U) (inhibits ERK). (A) Cells were pretreated with the indicated inhibitors for 30 min and then treated with 45 ng/ml nocodazole for 16 h. Attachment cells (I) and round-up cells (M) were pooled separately. These cellular extracts were analyzed using immunoblotting with anti-Sp1, anti-JNK, and anti-p-JNK antibodies. Actin and histone H3 were used as an equal loading control. (B) Total RNA was extracted from interphase or mitotic HeLa cells with or without SP600125 or U0126 treatment, and the Sp1 mRNA level was then determined by RT-PCR. Level of GAPDH mRNA was the internal control. From three independent experiments, the level of Sp1 mRNA was quantified. The p values reaching statistical significance are marked on the graph (*p < 0.05 and **p < 0.01). (C) HeLa cells were treated with different doses (0, 1.25, 2.5, 5, or 10 μM) of SP600125 and 45 ng/ml nocodazole. Interphase and mitotic cell lysates were collected separately, and the expression of Sp1 and actin was analyzed using the same methods as described in A. (D) HeLa cells were pretreated with or without SP600125 for 30 min, and then they were treated with 45 ng/ml nocodazole. After treatment, cells were collected at different time intervals (0, 5, 10, 15, or 20 h). These samples were immunoblotted using anti-Sp1 and anti-actin antibodies. (E) Different cell lines, HeLa, A549, and MDA-MB-231, were treated with 45 ng/ml nocodazole and 10 mM SP600125 (lanes 7–12). The attachment cells and round-up cells were then collected separately, and the level of Sp1 was determined by immunoblot of anti-Sp1 antibodies. Expression of activated JNK determined by anti-p-JNK antibodies was used as SP600125 treatment control and the actin level was used as an internal control. Lanes 1–6 show that HeLa, A549 and MAD-MB-231 cells were only treated with nocodazole as no SP600125 treatment control. (F) Cells were treated with nocodazole or cotreated with SP600125. Western blot of cell lysates using anti-JNK and anti-p-JNK antibodies confirmed JNK protein level and its activity. The same cell lysates were used for immunoblotting with anti-Sp1 antibodies to detect the level of ubiquitinated Sp1, α-tubulin, and histone H3 were used as an equal loading control. (G) The same lysates were used to do the immunoprecipitation with anti-ubiquitin antibodies, and the immunoblotting was performed with anti-Sp1 antibodies. Polyubiquitinated Sp1 is marked with a black line.
Figure 4.
Figure 4.
JNK1 phosphorylated Sp1 during mitosis. (A) HeLa cells were directly exposed or not exposed to UV radiation for 10 s and recultured in an incubator for 1 h to activate JNK. Cell lysates were immunoblotted using anti-Sp1 and anti-p-JNK antibodies. Actin was used as an equal loading control. (B) Sp1 was purified using immunoprecipitation with anti-Sp1 antibodies from HeLa cells, and was incubated with different doses of activated JNK (0, 0.015, 0.05, or 0.1 U) for a JNK kinase assay (see Materials and Methods). Products were immunoblotted using anti-Sp1 and anti-p-JNK antibodies. The IgG signal is from immunoprecipitated Sp1 antibodies.
Figure 5.
Figure 5.
Elevated JNK activation increased the phosphorylation of Sp1. (A) HeLa cells were obtained using synchronization for 16 h with 45 ng/ml nocodazole. Mitotic cells were shaken-off, washed with PBS, and replated in fresh medium. The released cells were collected at different time intervals (12, 16, 20, 22, or 24 h). These samples were immunoblotted using anti-Sp1 and anti-p-JNK antibodies. Anti-JNK antibodies were used to indicate that the total JNK in each of these samples was equal. Cyclin B1 was used as a mitotic phase marker, and cyclin E was used as a G1/S phase marker. Actin was used as an equal loading control. (B) HeLa cells were treated with double thymidine to synchronize cells in G1/S phase and then washed with PBS and recultured in fresh medium to release the cell cycle. Cells were collected at different time intervals (0, 4, 6, 8, 10, 11, or 20 h). Cell lysates were prepared and immunoblotted using antibodies against Sp1, JNK, p-JNK, cyclin B1, and actin.
Figure 6.
Figure 6.
JNK phosphorylated the Thr278/739 sites of Sp1. (A) The potential JNK-phosphorylated Thr/Ser sites of Sp1 are indicated (S59, S73, T117, T278, T355, T453, T503, S588, and T739), and different GST-Sp1 deletion constructs are also indicated. (B) Known D-sites in JNK-binding proteins aligned with the putative D-sites in Sp1. D1 and D2 are located in residues 706-726 and residues 135-155, and they are marked in A. Consensus basic (+) and hydrophobic (φ) residues are shown in a gray background. (C) The different GST-Sp1 fragments (amino acids [aa] 8-290, aa 8-618, and aa 619-785) were combined with [γ-32P]ATP and activated JNK for an in vitro kinase assay (lanes 6–8). The expressions of these fragments were detected using Coomassie Blue (lanes 11–15) or immunoblotted using anti-Sp1 antibodies (lanes 16–18). (D) The potential JNK-phosphorylated serine/threonine sites were mutated to alanine as indicated. These mutated GST-Sp1 proteins were expressed in E. coli and purified. The yields of these mutants were detected using Coomassie Blue staining (bottom). Products were analyzed as described in C. Bovine serum albumin (BSA) was used to compare the concentration of proteins in Coomassie Blue staining.
Figure 7.
Figure 7.
The Sp1 mutated at 278/739 was more unstable than wild-type Sp1 in cells. (A) HeLa cells were transfected with HA-Sp1, HA-Sp1(T278A), HA-Sp1(T739A), or HA-Sp1(T278/739A). The cell extracts were prepared from these HeLa cells and immunoblotted using anti-HA and anti-α-tubulin antibodies. The cells were transfected with control vector (lane 1). Total RNA was extracted from these HeLa cells and underwent RT-PCR using specific primers for HA-Sp1 (Sp1-forward and Sp6 reverse) and GAPDH. HA-Sp1 mRNA was used as an equal control for transfection efficiency. (B) pHA, pHA-Sp1, pHA-Sp1 (T278A), pHA-Sp1 (T739A), and pHA-Sp1 (T278/739A) were transfected into HeLa cells for 12 h, and cells were then arrested at mitosis stage by nocodazole treatment (45 ng/ml) for 16 h. Equal mitotic cell number was used to determine the Sp1 level by immunoblot with anti-HA antibodies, and the tubulin was used as the internal control. From three independent experiments, the level of HA-Sp1, HA-Sp1(T278A), HA-Sp1(T739A), and HA-Sp1(T278/739A) was quantified and normalized with that of tubulin. Only statistically significant p values are shown (*p < 0.05 and **p < 0.01). (C) pGFP, pGFP-Sp1, pGFP-Sp1(T278/739A), and pHA-Sp1 (T278/739D) were transfected into HeLa cells for 12 h, and cells were then arrested at mitosis stage by nocodazole treatment (45 ng/ml) for 16 h. Equal mitotic cell number was used to determine the Sp1 and ubiquitinated Sp1 level by immunoblot with anti-GFP antibodies, and the tubulin was used as the internal control. (D) pGFP, pGFP-Sp1, pGFP-Sp1(T278/739A), and pHA-Sp1 (T278/739D) were transfected into HeLa cells for 12 h, and cells were then arrested at mitosis stage by nocodazole treatment (45 ng/ml) for 16 h. Half-life of GFP-Sp1 and its mutants was determined in the presence of cycloheximide. After three independent experiments, the level of Sp1 protein was quantified. Statistically significant differences are indicated by the corresponding p values of Student's t test (*p < 0.05 and **p < 0.01). (E) Four shRNA-JNK1s (shRNA-JNK1-1, shRNA-JNK1-2, shRNA-JNK1-3, and shRNA-JNK1-4) were transfected into HeLa cells individually for 48 h. Cells were harvested and analyzed with immunoblot of anti-Sp1, anti-JNK1, anti-phospho-JNK1, and anti-tubulin antibodies. (F) HA-Sp1, HA-Sp1(T278A), HA-Sp1(T739A), or HA-Sp1(T278/739A) were cotransfected with pXP 7-1, the promoter of 12(S)-lipoxygenase, into HeLa cells for 24 h, and the luciferase activity was then analyzed. All of the experiments were done three times independently. The p values reaching statistical significance are marked on the graph (*p < 0.05 and **p < 0.01). (G) pGFP, pGFP-Sp1, pGFP-Sp1 (T278A), pGFP-Sp1 (T739A), and pGFP-Sp1 (T278/739A) were transfected into HeLa cells, and the cell number was then counted after 18-, 36-, and 54-h incubation. All of the experiments were independently performed three times, and the statistical analysis was performed by Student's t test.
Figure 8.
Figure 8.
Sp1 accumulation and JNK activation in glioma cells and MNU-induced tumor. (A) Rat glioma C6 cell line (lanes 1 and 2) and primary glial cells from postnatal day 0 to day 1 rat pups (lanes 3 and 4) were treated with nocodazole for 24 h, and then they were divided into interphase and mitotic cells. These cellular extracts were probed using anti-Sp1 and p-JNK antibodies. The α-tubulin was used as an equal loading control. (B) The normal cervical tissue (N) and cervical cancer tissue (T) were subjected to immunoblot analysis by using antibodies against Sp1. Actin was used as an equal loading control (C) Rats intraperitoneal injected with 50 mg/kg MNU were killed after 8 wk, and the normal and tumor tissues were then harvested. The arrow indicated the nipple position. (D) H&E staining was performed to determine the tissue and tumor type. (E) Estrogen receptor recognized by its antibodies inside the tissue was considered as a mammalian cancer marker. The intestine and kidney tissues were used as the negative control. (F) Sp1 level was determined in the normal and tumor mammalian tissues by immunohistochemistry by using anti-Sp1 antibodies. (G) The level of Sp1, JNK1, and p-JNK1 in normal and tumor tissues was studied by immunoblot with anti-Sp1, anti-JNK1, and anti-phospho-JNK antibodies, respectively.

References

    1. Abdelrahim M., Safe S. Cyclooxygenase-2 inhibitors decrease vascular endothelial growth factor expression in colon cancer cells by enhanced degradation of Sp1 and Sp4 proteins. Mol. Pharmacol. 2005;68:317–329. - PubMed
    1. Abdelrahim M., Smith R., 3rd, Burghardt R., Safe S. Role of Sp proteins in regulation of vascular endothelial growth factor expression and proliferation of pancreatic cancer cells. Cancer Res. 2004;64:6740–6749. - PubMed
    1. Armstrong S. A., Barry D. A., Leggett R. W., Mueller C. R. Casein kinase II-mediated phosphorylation of the C terminus of Sp1 decreases its DNA binding activity. J. Biol. Chem. 1997;272:13489–13495. - PubMed
    1. Benasciutti E., Pages G., Kenzior O., Folk W., Blasi F., Crippa M. P. MAPK and JNK transduction pathways can phosphorylate Sp1 to activate the uPA minimal promoter element and endogenous gene transcription. Blood. 2004;104:256–262. - PubMed
    1. Bonello M. R., Khachigian L. M. Fibroblast growth factor-2 represses platelet-derived growth factor receptor-α (PDGFR-α) transcription via ERK1/2-dependent Sp1 phosphorylation and an atypical cis-acting element in the proximal PDGFR-α promoter. J. Biol. Chem. 2004;279:2377–2382. - PubMed

Publication types

MeSH terms