. 2008 Jan 16;28(3):622-32.
doi: 10.1523/JNEUROSCI.2986-07.2008.

Ctip2 controls the differentiation of medium spiny neurons and the establishment of the cellular architecture of the striatum

Affiliations

Ctip2 controls the differentiation of medium spiny neurons and the establishment of the cellular architecture of the striatum

Paola Arlotta et al. J Neurosci. .

Abstract

Striatal medium spiny neurons (MSN) are critically involved in motor control, and their degeneration is a principal component of Huntington's disease. We find that the transcription factor Ctip2 (also known as Bcl11b) is central to MSN differentiation and striatal development. Within the striatum, it is expressed by all MSN, although it is excluded from essentially all striatal interneurons. In the absence of Ctip2, MSN do not fully differentiate, as demonstrated by dramatically reduced expression of a large number of MSN markers, including DARPP-32, FOXP1, Chrm4, Reelin, MOR1 (mu-opioid receptor 1), glutamate receptor 1, and Plexin-D1. Furthermore, MSN fail to aggregate into patches, resulting in severely disrupted patch-matrix organization within the striatum. Finally, heterotopic cellular aggregates invade the Ctip2-/- striatum, suggesting a failure by MSN to repel these cells in the absence of Ctip2. This is associated with abnormal dopaminergic innervation of the mutant striatum and dramatic changes in gene expression, including dysregulation of molecules involved in cellular repulsion. Together, these data indicate that Ctip2 is a critical regulator of MSN differentiation, striatal patch development, and the establishment of the cellular architecture of the striatum.


Figures

Figure 1.
Figure 1.
CTIP2 is specifically expressed in medium spiny neurons. A–D, CTIP2 expression in MSN labeled with DARPP-32. A, Coronal section of adult striatum, showing colocalization of CTIP2 (red) with DARPP-32 labeled MSN (green). B, C, High-magnification image of DARPP-32 expression (B) and CTIP2-labeled nuclei (C) in the boxed area in A. D, Merged image of B and C, showing that all DARPP-32 labeled MSN express CTIP2. E–H, CTIP2 expression in MSN labeled with FOXP1. E, Coronal section of adult striatum, showing colocalization of CTIP2 (red) with FOXP1 labeled MSN (green). F, G, High-magnification image of FOXP1-labeled MSN (F) and CTIP2-labeled nuclei (G) in the boxed area in E. H, Merged image of F and G, showing that all FOXP1-labeled MSN express CTIP2. Fewer than 1% of CTIP2-labeled cells are FOXP1 negative (arrowhead). Arrows indicate examples of colocalization. Scale bars: A, E, 200 μm; B–D, F–H, 10 μm.
Figure 2.
Figure 2.
CTIP2 is not expressed in striatal interneurons. A, B, Somatostatin expression (A) and CTIP2-labeled nuclei (B) in the same area as A. C, Merged image of A and B showing that no somatostatin-expressing interneurons express CTIP2. D, E, ChAT expression (D) and CTIP2-labeled nuclei (E) in the same area as D. F, Merged image of D and E, showing that no ChAT-expressing interneurons express CTIP2. G, H, Calretinin expression (G) and CTIP2-labeled nuclei (H) in the same area as G. I, Merged image of G and H showing that no Calretinin-expressing interneurons express CTIP2. J, K, Parvalbumin expression (J) and CTIP2-labeled nuclei (K) in the same area as J. L, Merged image of J and K showing that no parvalbumin-expressing interneurons express CTIP2. Arrows indicate examples of cells that do not express CTIP2. Scale bars, 20 μm.
Figure 3.
Figure 3.
CTIP2 is expressed in postmitotic MSN during development and maintained in mature MSN. A, CTIP2 expression at E13.5 in coronal section. B, At E17.5, CTIP2 is expressed at high levels in the striatum. C, CTIP2 continues to be expressed in mature MSN across the entire striatum. D, Confocal photograph of E13.5 LGE showing postmitotic Dcx- (green) and CTIP2-expressing (red) MSN in the mantle zone. E, F, High-magnification confocal photographs showing colocalization of CTIP2 (E) and Dcx (F) expression in the area indicated in D (asterisk). G, Merged image of E and F. H, Confocal photograph of E13.5 LGE showing PH3-positive (green) progenitors in the VZ/SVZ and CTIP2 (red) negative cells in the same areas. I, J, High-magnification confocal photograph in the area indicated in H (asterisk), showing that PH3-positive nuclei (J) do not express CTIP2 (I). K, Merged image of I and J. L, Confocal photograph of E13.5 LGE, showing BrdU-positive (green) progenitors in the VZ/SVZ (labeled via BrdU pulse), and CTIP2-negative (red) cells in the same areas. M, N, High-magnification confocal photographs in the area indicated in L (asterisk), showing that BrdU-positive nuclei (N) do not express CTIP2 (M). O, Merged image of M and N. ctx, Cortex; str, striatum; MGE, medial ganglionic eminence; LV, lateral ventricle. Scale bars: A–C, 100 μm; D, H, L, 40 μm; E–G, I–K, M–O, 10 μm.
Figure 4.
Figure 4.
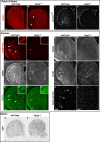
MSN in Ctip2−/− striatum fail to aggregate into patches and exhibit abnormalities in gene expression. A–D, Coronal sections of wild-type (A, C) and Ctip2−/− (B, D) striatum at P0, showing that FOXP1 expression is decreased and Chrm4 is virtually absent from both patch and matrix MSN across the entire striatum in Ctip2 mutants with several distinct areas exhibiting a more severe decrease in FOXP1 expression (B, arrows). E–P, Coronal sections of wild-type and Ctip2−/− striatum at P0 stained with patch-specific markers. E, DARPP-32 staining of a coronal section through wild-type striatum reveals many developing striatal patches that are stained intensely for DARPP-32. F, In contrast, DARPP-32 expression is dramatically decreased in the Ctip2 mutant striatum, in which DARPP-32 is expressed at very low levels by only a small number of cells in lateral striatum (arrowhead; and higher magnification in F'). G, Reelin staining in wild-type striatum reveals many developing patches (arrows). H, In contrast no distinct patches are identified in the mutant striatum when stained for Reelin. I, MOR1 staining in wild-type striatum reveals many developing striatal patches of typical morphology. J, In contrast, the number of striatal patches is greatly decreased in the Ctip2−/− striatum, with the appearance of large cell aggregates of abnormal morphology that are distinct from typical patches (arrowhead). K, Similarly, GluR1 staining of wild-type striatum reveals developing striatal patches. L, In contrast, the number of striatal patches detected in matched sections from Ctip2−/− striatum is greatly decreased, and large cellular aggregates of abnormal morphology appear (arrowhead). M, N, MAP-2 staining of the same sections that are shown in E and F, respectively. M, MAP2 is expressed in cells throughout the wild-type striatum, with the highest expression levels in developing striatal patches (arrows; and higher magnification image in M'). N, In contrast, a matched section from a Ctip2 mutant stained for MAP2 shows that the number of striatal patches is greatly decreased (arrowhead), and patch morphology is abnormal in the Ctip2−/− striatum. O, P, BrdU-stained coronal sections from E19.5 wild-type (O) and matched Ctip2−/− (P), labeled by a single injection of BrdU at E12.5. O, Wild-type striatum cells containing nuclei that are intensely BrdU positive (indicating a birthdate of E12.5) cluster together (arrows). P, In contrast, no aggregation of BrdU-positive cells is observed in Ctip2−/− striatum, indicating that patch neurons do not aggregate, and that the abnormal cell aggregates shown in J and L do not contain patch MSN. Q, R, In situ hybridization on wild-type (Q) and Ctip2−/− (R) striatum showing comparable levels of Ebf1, a marker of matrix MSN. Scale bars: A–R, 100 μm, E', F', M', N', 20 μm.
Figure 5.
Figure 5.
Changes in gene expression in the striatum of Ctip2−/− mice. A–L, In situ hybridizations on coronal sections from wild-type and Ctip2−/− striatum at P0, showing genes with decreased expression (A–F), or increased expression (G–L) within the striatum of Ctip2−/− mice. Differences in gene expression are caused by a true, striatum-specific effect of Ctip2 loss on gene regulation, as indicated by comparable expression of these genes in other regions of the brain, including the cortex (Plexin-D1, Nectin-3, Neto1) (A, C, F), the choroid plexus (Pcp4L1) (E), the ependymal layer (Ngef) (B), and additional cell populations outside the striatum (Kcnip2, secretagogin, Neurotensin) (D, J, L). Scale bars: A–L, 100 μm.
Figure 6.
Figure 6.
Abnormal nigrostriatal innervation of the Ctip2−/− striatum. A, E, Coronal sections of wild-type (A) and mutant (E) developing striatum at E15.5 stained with TH, showing comparable distribution of TH innervation at this age, before aggregation of the patches occurs. B–D, F–H, Coronal sections of wild-type (B–D) and Ctip2−/− (F–H) striatum at P0 stained with TH and secretagogin. B, TH staining of wild-type striatum reveals distinct colocalization with developing striatal patches (arrows). F, In contrast, TH staining is diffuse and disorganized in Ctip2−/− striatum, showing no colocalization with patches, and delineating distinct areas of TH depletion (arrowheads). C, Secretagogin staining reveals no cells are labeled in wild-type striatum. D, Merged image of B and C. G, In contrast, large aggregates of secretagogin positive cells are present in Ctip2−/− striatum; these aggregates exclude TH innervation (H). Scale bars: A–H, 50 μm.
Figure 7.
Figure 7.
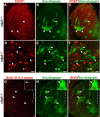
Ectopic non-MSN cellular aggregates populate the Ctip2−/− striatum. A–C, Coronal sections through Ctip2−/− striatum, showing colocalization of large secretagogin-positive aggregates, with areas of highly reduced FOXP1 expression (arrows). D–F, Confocal images of selected secretagogin-positive cells from the large aggregates shown in B, showing that a small percentage of the secretagogin-positive cells express FOXP1, a marker of MSN (arrows), whereas the majority do not express FOXP1 (arrowheads). G–I, Coronal sections of Ctip2−/− striatum at P0 stained with BrdU (administered via single injection at E12.5) (G) and secretagogin (H), showing that secretagogin-positive aggregates do not specifically overlap with BrdU labeled cells (arrows) and, thus, are not born at E12.5 (i.e., peak neurogenesis of patch MSN). Insets show enlarged image of aggregate indicated by most dorsal arrow. I, Merged image of G and H. Scale bars: A–C, G–I, 50 μm, D–F, 10 μm.
Figure 8.
Figure 8.
Molecular mechanisms of cellular repulsion are dysregulated in Ctip2−/− striatum. A, B, Coronal sections of wild-type (A) and Ctip2−/− (B) brain at E15.5, showing comparable distribution of Secretagogin-positive cells at early stages of striatal development. C, D, Sagittal/oblique sections of wild-type (C) and Ctip2−/− (D) forebrain at P0, showing the distribution of Secretagogin-positive cells. C, Wild-type brain shows typical distribution of secretagogin cells ventral to the striatum and in the olfactory bulb (arrows). D, In contrast, large clusters of Secretagogin cells infiltrate the Ctip2−/− striatum (arrowhead). E–J, In situ hybridizations of coronal sections through wild-type (E, G, I) and Ctip2−/− (F, H, J) striatum at P0, Neuropilin 1 is absent from the wild-type striatum (E), but is expressed within cellular aggregates in the mutant striatum (F, arrows). Developing wild-type and Ctip2−/− striatum exhibits equivalent levels of Semaphorin 3A (G, H) and Semaphorin 3F (I, J) expression. str, Striatum; MGE, medial ganglionic eminence; ob, olfactory bulb. Scale bars: A, B, 50 μm; C–J, 100 μm.

References

    1. Albin RL, Young AB, Penney JB. The functional anatomy of basal ganglia disorders. Trends Neurosci. 1989;12:366–375. - PubMed
    1. Anderson KD, Reiner A. Immunohistochemical localization of DARPP-32 in striatal projection neurons and striatal interneurons: implications for the localization of D1-like dopamine receptors on different types of striatal neurons. Brain Res. 1991;568:235–243. - PubMed
    1. Anderson SA, Eisenstat DD, Shi L, Rubenstein JL. Interneuron migration from basal forebrain to neocortex: dependence on Dlx genes. Science. 1997a;278:474–476. - PubMed
    1. Anderson SA, Qiu M, Bulfone A, Eisenstat DD, Meneses J, Pedersen R, Rubenstein JL. Mutations of the homeobox genes Dlx-1 and Dlx-2 disrupt the striatal subventricular zone and differentiation of late born striatal neurons. Neuron. 1997b;19:27–37. - PubMed
    1. Arlotta P, Molyneaux BJ, Chen J, Inoue J, Kominami R, Macklis JD. Neuronal subtype-specific genes that control corticospinal motor neuron development in vivo. Neuron. 2005;45:207–221. - PubMed

Publication types

MeSH terms