. 2008 Jan 16;28(3):633-49.
doi: 10.1523/JNEUROSCI.3388-07.2008.

Low-pass filter properties of basal ganglia cortical muscle loops in the normal and MPTP primate model of parkinsonism

Affiliations

Low-pass filter properties of basal ganglia cortical muscle loops in the normal and MPTP primate model of parkinsonism

Michal Rivlin-Etzion et al. J Neurosci. .

Abstract

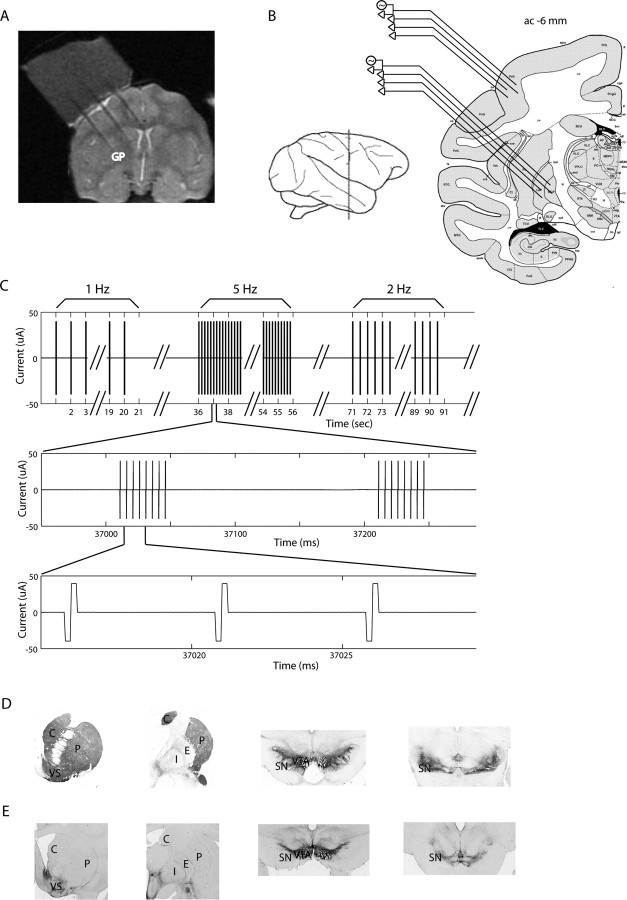
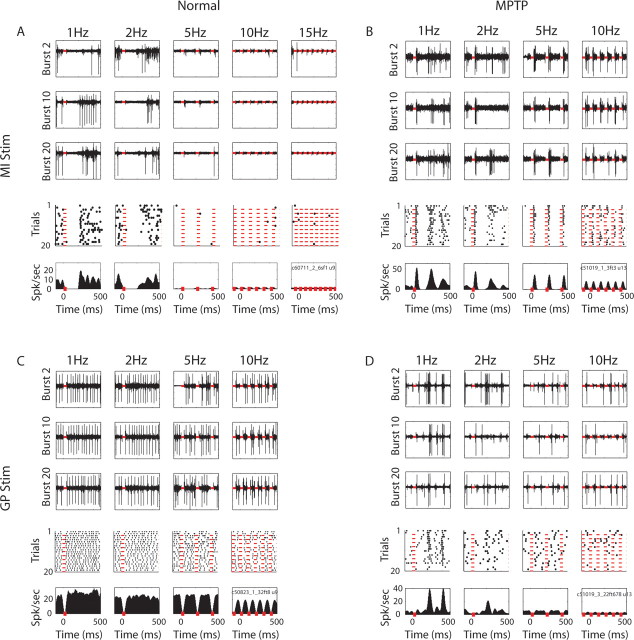
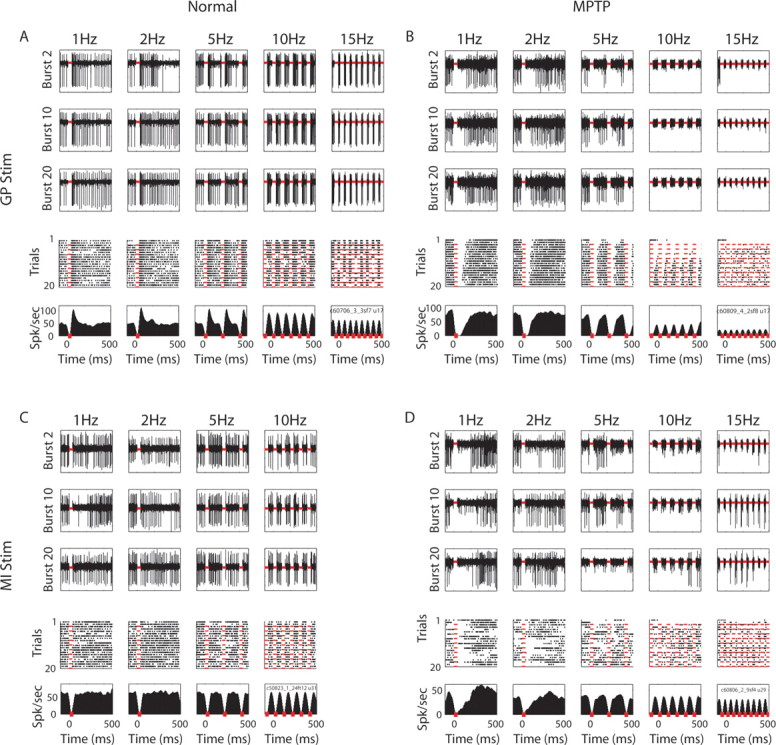
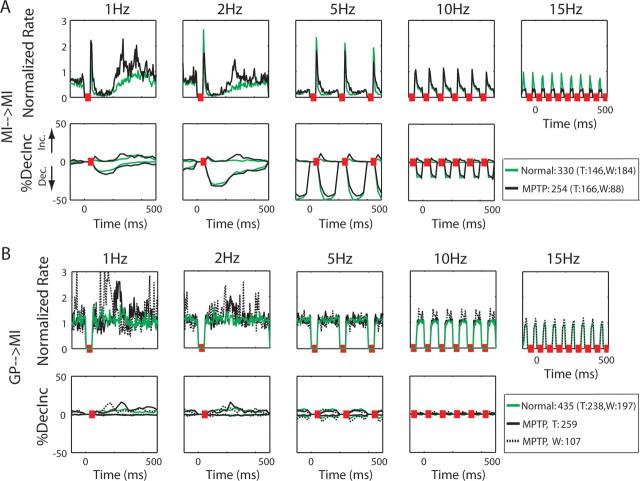
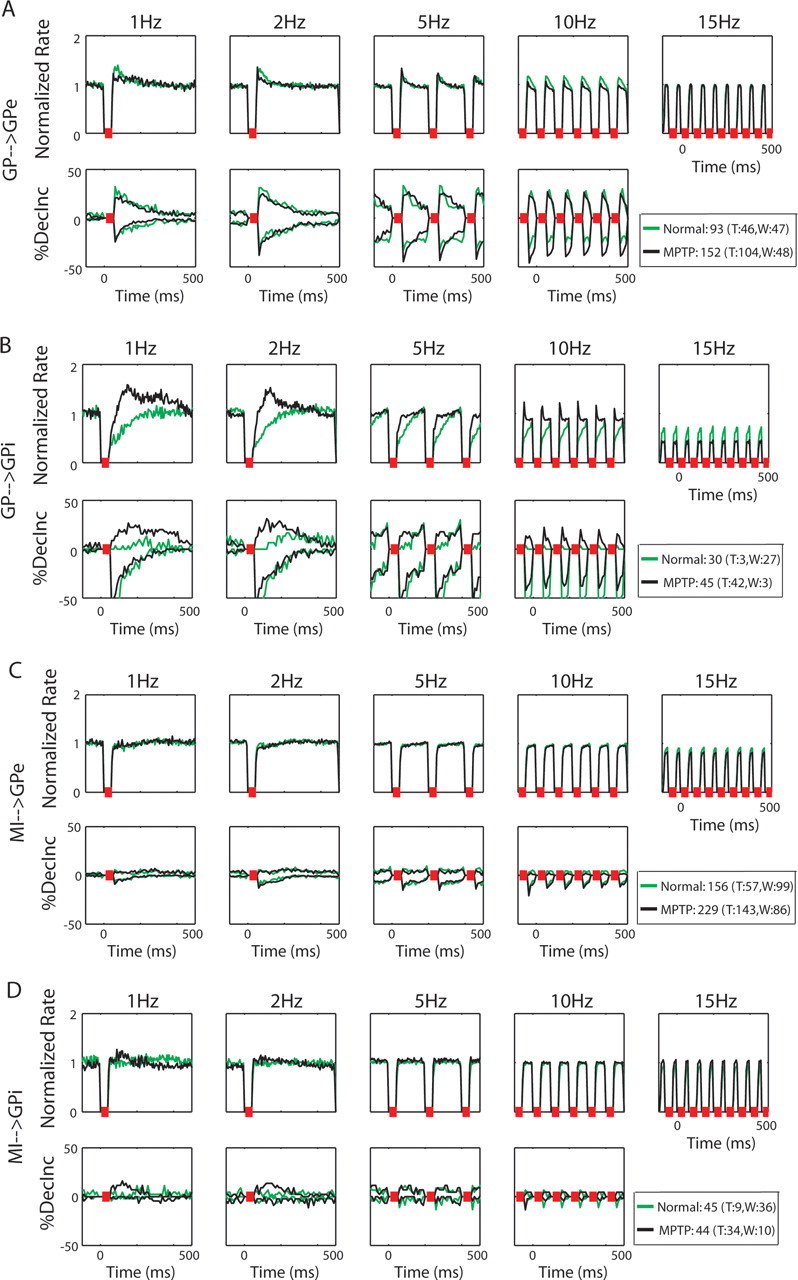
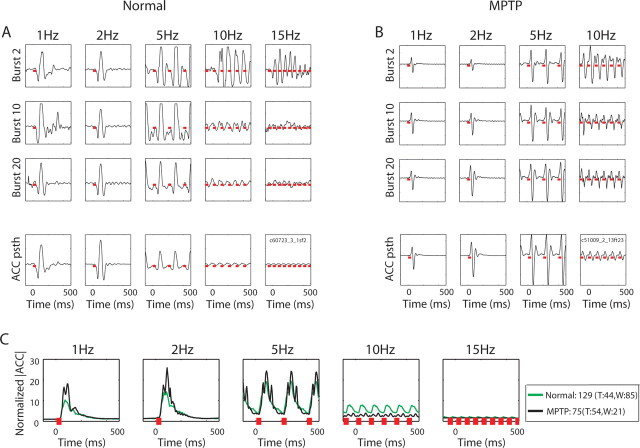
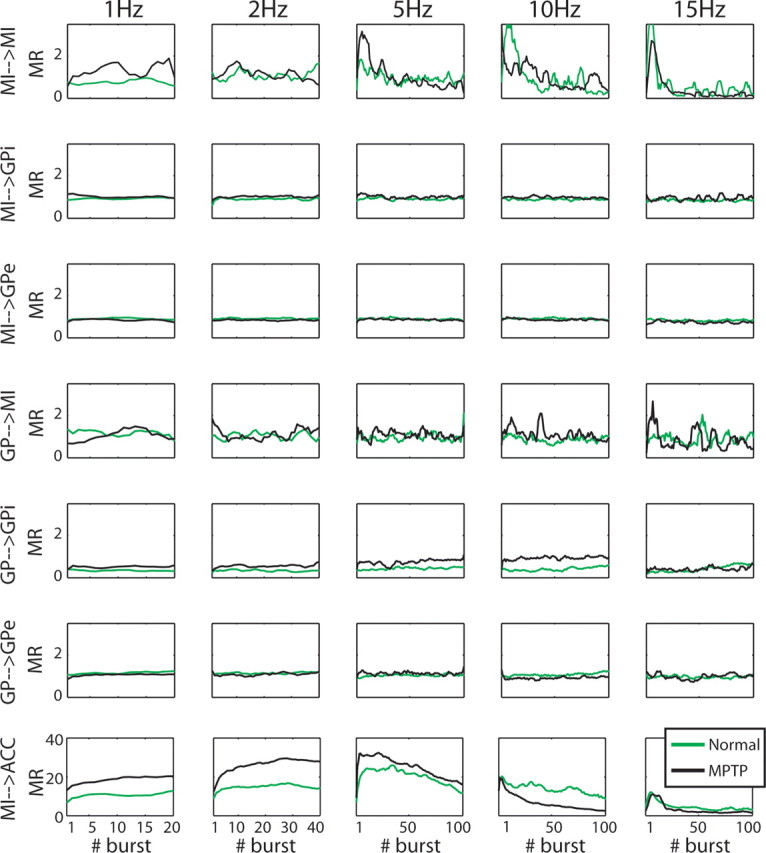
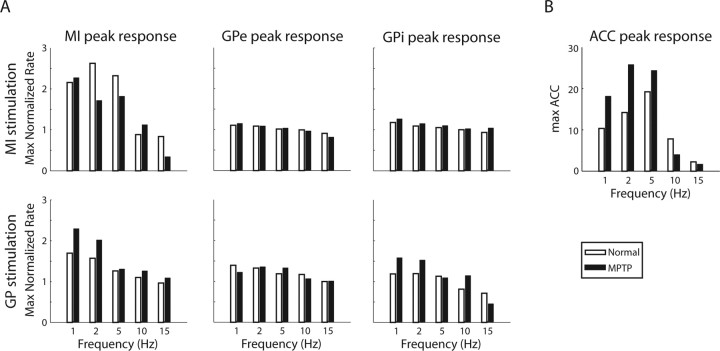
Oscillatory bursting activity is commonly found in the basal ganglia (BG) and the thalamus of the parkinsonian brain. The frequency of these oscillations is often similar to or higher than that of the parkinsonian tremor, but their relationship to the tremor and other parkinsonian symptoms is still under debate. We studied the frequency dependency of information transmission in the cortex-BG and cortex-periphery loops by recording simultaneously from multiple electrodes located in the arm-related primary motor cortex (MI) and in the globus pallidus (GP) of two vervet monkeys before and after 1-methyl-4-phenyl-1,2,3,6-tetrahydropyridine (MPTP) treatment and induction of parkinsonian symptoms. We mimicked the parkinsonian bursting oscillations by stimulating with 35 ms bursts given at different frequencies through microelectrodes located in MI or GP while recording the evoked neuronal and motor responses. In the normal state, microstimulation of MI or GP does not modulate the discharge rate in the other structure. However, the functional-connectivity between MI and GP is greatly enhanced after MPTP treatment. In the frequency domain, GP neurons usually responded equally to 1-15 Hz stimulation bursts in both states. In contrast, MI neurons demonstrated low-pass filter properties, with a cutoff frequency above 5 Hz for the MI stimulations, and below 5 Hz for the GP stimulations. Finally, muscle activation evoked by MI microstimulation was markedly attenuated at frequencies higher than 5 Hz. The low-pass properties of the pathways connecting GP to MI to muscles suggest that parkinsonian tremor is not directly driven by the BG 5-10 Hz burst oscillations despite their similar frequencies.


Figures

Figure 1.
Figure 1.
Experimental procedure and histology. A, MRI of monkey W. An example of a coronal image. Three tungsten electrodes separated by a horizontal distance of 6 mm were inserted in the same coronal plane (ac −2, 2 mm posterior to the anterior commissure) through the recording chamber. The recording chamber is filled with 3% agar. B, Left, A schematic illustration showing the location of ac −6 coronal plane. The coronal plane crosses the central sulcus and the primary motor cortex. Right, A scheme of ac −6 coronal plane and the experimental setup: four electrodes in the GP and four electrodes in the motor cortex. Any electrode could be used as a stimulating electrode, while the other electrodes are recording. The atlas scheme is (Figure legend continues.) adapted from Martin and Bowden (2000). C, The stimulation pattern includes 35 ms bursts with intraburst frequency of 200 Hz (8 pulses per burst); each pulse is symmetric biphasic, negative phase leading. The bursts were given at different frequencies for 20 s: 1 (a total of 20 bursts), 2, 5, 10 Hz, and, for monkey W, also 15 Hz (a total of 300 bursts). The interval between the frequency tests was 15 s, and the order of frequencies was 5, 10, 1, 2 and, 10, 1, 2, 5, 15 Hz, for monkeys T and W, respectively. D, E, Photomicrographs of TH staining demonstrating the loss of dopaminergic substantia nigra pars compacta neurons in the MPTP-treated monkey T compared with a control animal. D was taken from a control normal macaque monkey; E is from the MPTP-treated monkey T (vervet). The photomicrographs illustrate the levels of rostral striatum (column 1), central striatum (column 2), and midbrain (columns 3, 4). Note the lack of TH-positive staining throughout the striatum with the exception of the ventral striatum, particularly the shell region. TH-positive cells are selectively lost in the ventral tier but spared in the ventral tegmental area. C, Caudate; P, putamen; VS, ventral striatum; SN, substantia nigra; VTA, ventral tegmental area; E, GPe; I, GPi.
Figure 2.
Figure 2.
Responses of single primary motor cortex (MI) neurons to stimulation. A, MI neuron response to MI stimulation in the normal state. Three top rows, The bandpass filtered analog data recorded from an electrode located in MI while stimulating through another MI electrode in monkey W. First, second, and third rows show the response to the 2nd, 10th, and 20th bursts in each frequency test, respectively. All periods of stimulation bursts (40 ms per burst, to enable recovery from the last stimulus artifact) were off-line deleted and are marked by red lines. Fourth row, Raster displays of the neuron. Each dot in the raster represents an action potential of the neuron. For illustration purposes, in conditions with >20 trials (i.e., for 2 Hz and higher-frequency tests), only a subset of 20 equally distributed trials is shown in the raster plots. Bottom, The mean firing rates aligned on the stimulation bursts (PSTH). Bin size, 5 ms. PSTHs are smoothed with a Gaussian window, σ = 15 ms. Note that the analog data recorded from the electrode reveal action potentials from more than a single neuron (see burst 2 of the 2 Hz frequency test), but here we focused on the cell with the highest signal-to-noise ratio. B, MI neuron response to stimulation in MI in the MPTP state of monkey T, same convention as A. C, D, Responses of MI neurons to stimulation in GP in the normal and MPTP states, monkey T, same convention as A.
Figure 3.
Figure 3.
Responses of single pallidal neurons to stimulation. A, GPe neuron response to stimulation in GP in the normal state of monkey W. B, GPi neuron response to stimulation in GP in the MPTP state of monkey W. C, GPi neuron response to stimulation in MI in the normal state of monkey T. D, GPe neuron response to stimulation in MI in the MPTP state of monkey W. Conventions as in Figure 2A.
Figure 4.
Figure 4.
MI population response to stimulations. A, MI population response to stimulation in MI in the normal and MPTP states. Top, The population PSTH of all recorded cortical neurons in response to cortical stimulation. PSTHs were normalized by the spontaneous firing rate of the cell (see Materials and Methods). Mean PSTH is shown as a green line for the normal state and as a black line for the MPTP state. Bottom, Fraction of cells with significant modulations in firing rate around the stimulation burst. The ordinate is the fraction of cells that had a significant response at each time bin (bin size was 25 ms in all frequencies except 10 Hz stimulation, in which bin size was 10 ms). The values above 0 are the fraction of cells that increased their firing rate, and the values below 0 are the fraction of cells that decreased their firing rate. The total number of recorded neurons in each of the states is given in the legend, and the numbers in parentheses detail the number of neurons recorded from monkeys T and W separately. B, MI population response to stimulation in GP in the normal and MPTP states. The green line represents the population of both monkeys in the normal state, black solid line represents the population of monkey T in the MPTP state, and dotted black line represents the population of monkey W in the MPTP state. All other conventions as in A.
Figure 5.
Figure 5.
GP population response to stimulations. A, GPe population response to stimulation in GP in the normal (green) and MPTP (black) states. B, GPi population response to stimulation in GP in the normal and MPTP states. C, GPe population response to stimulation in MI in the normal and MPTP states. D, GPi population response to stimulation in MI in the normal and MPTP states. Conventions as in Figure 4A, except bin size, which was 10 ms for all frequencies.
Figure 6.
Figure 6.
Arm acceleration as a result of MI microstimulation. A, An example of the acceleration recorded from an accelerometer located on the back of the wrist while stimulating through an electrode in the contralateral motor cortex of monkey W in the normal state. First, second, and third lines show the responses to the 2nd, 10th, and 20th bursts in each frequency, respectively. All periods of stimulation bursts (40 ms per burst) are marked by red lines. Bottom, Mean acceleration values of the session aligned on the stimulation bursts. Ordinate units are arbitrary (A/D values). B, An example of arm acceleration recorded during MI stimulations in monkey T in the MPTP state. Conventions as in A. C, The normalized population PSTH of the absolute acceleration values in response to MI stimulation in the normal and MPTP states. Only sessions in which MI stimulation evoked movements are included. The average of the normalized responses is shown in green for the normal state and in black for the MPTP state. Other conventions as in Figures 4 and 5.
Figure 7.
Figure 7.
The neuronal response of most BG–cortex pathways to the different frequency tests are not affected by the number of bursts in the test. The mean normalized firing rate [mean response (MR)] in the 25 ms that follow each burst as a function of the sequential number of burst. For illustration purposes, only up to the first 100 bursts are shown. The last row illustrates the average of the maximum amplitude in the normalized absolute arm acceleration as a function of the number of burst. All curves were smoothed using a moving average of five bursts. Green and black lines represent normal and MPTP states, respectively.
Figure 8.
Figure 8.
Frequency domain analysis of the BG–cortex–muscle network. A, The maximum value of the normalized population PSTH of MI, GPi, and GPe neurons as a function of the stimulation frequency given in each of the structures (MI and GP). B, The maximum normalized absolute amplitude of the arm acceleration (ACC) as a function of the stimulation frequency in MI. A value of 1 stands for the mean ACC value in the “no movement” periods (when no stimulation occurred). Green and black bars correspond to the normal and MPTP states, respectively.

Similar articles

Cited by

References

    1. Alberts WW. A simple view of parkinsonian tremor, electrical stimulation of cortex adjacent to the rolandic fissure in awake man. Brain Res. 1972;44:357–369. - PubMed
    1. Albin RL, Young AB, Penney JB. The functional anatomy of basal ganglia disorders. Trends Neurosci. 1989;12:366–375. - PubMed
    1. Alexander GE, DeLong MR. Microstimulation of the primate neostriatum. I. Physiological properties of striatal microexcitable zones. J Neurophysiol. 1985;53:1401–1416. - PubMed
    1. Alexander GE, DeLong MR, Strick PL. Parallel organization of functionally segregated circuits linking basal ganglia and cortex. Annu Rev Neurosci. 1986;9:357–381. - PubMed
    1. Asanuma H, Rosen I. Topographical organization of cortical efferent zones projecting to distal forelimb muscles in the monkey. Exp Brain Res. 1972;14:243–256. - PubMed

Publication types

MeSH terms

Substances

LinkOut - more resources