. 2008 Feb 6;27(3):522-34.
doi: 10.1038/sj.emboj.7601982. Epub 2008 Jan 17.

Spatial and temporal role of the apelin/APJ system in the caliber size regulation of blood vessels during angiogenesis

Affiliations

Spatial and temporal role of the apelin/APJ system in the caliber size regulation of blood vessels during angiogenesis

Hiroyasu Kidoya et al. EMBO J. .

Abstract

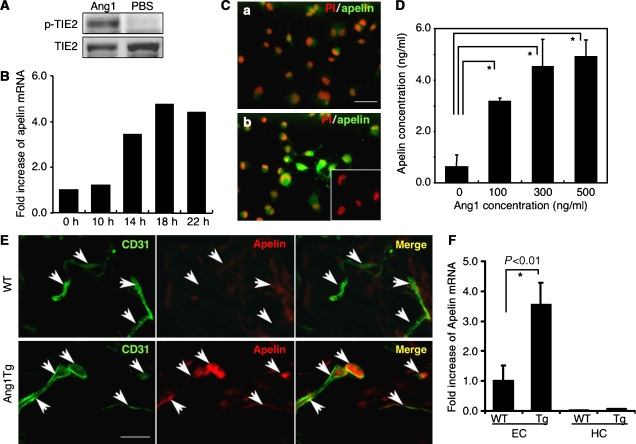
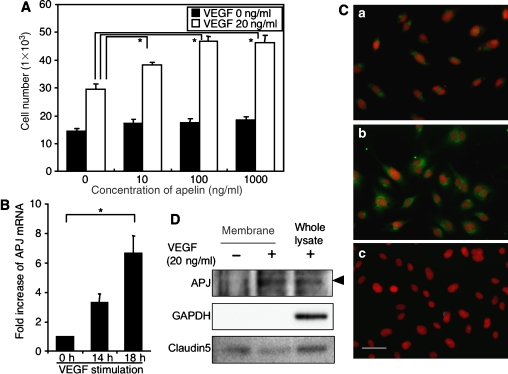
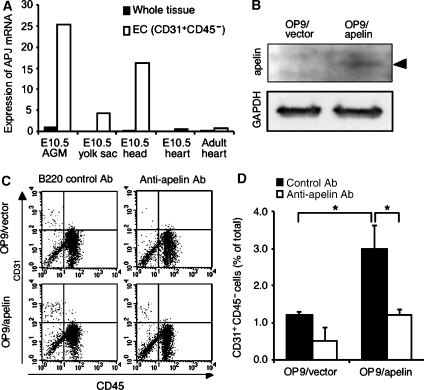
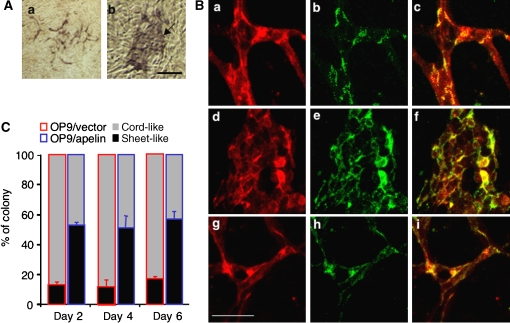
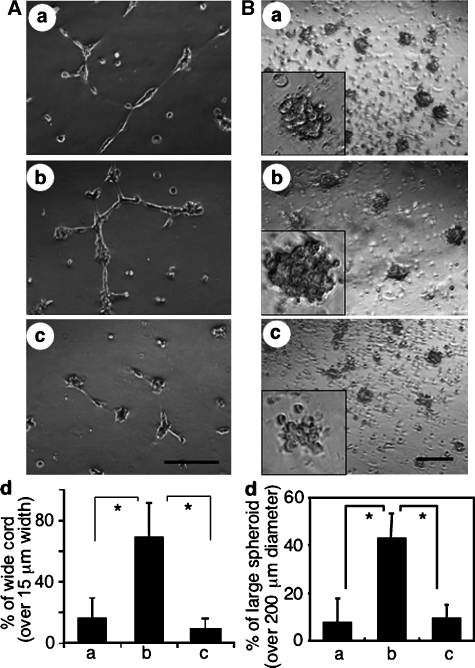
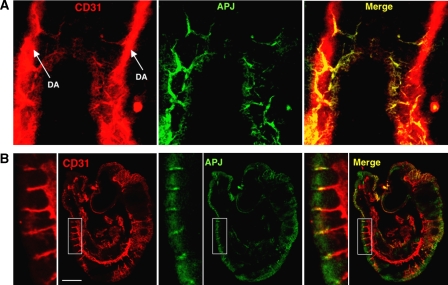
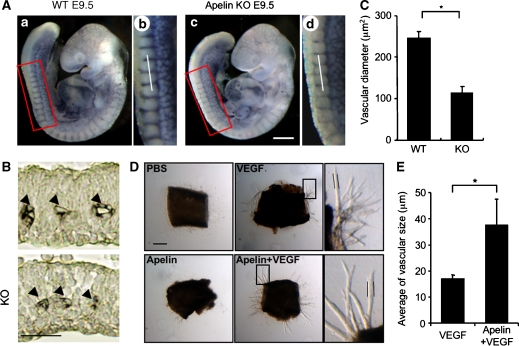
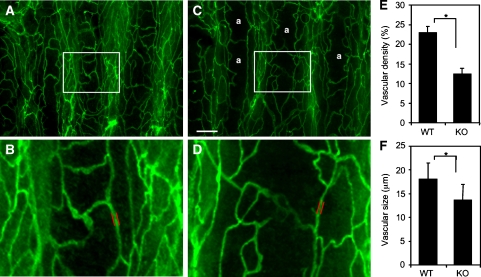
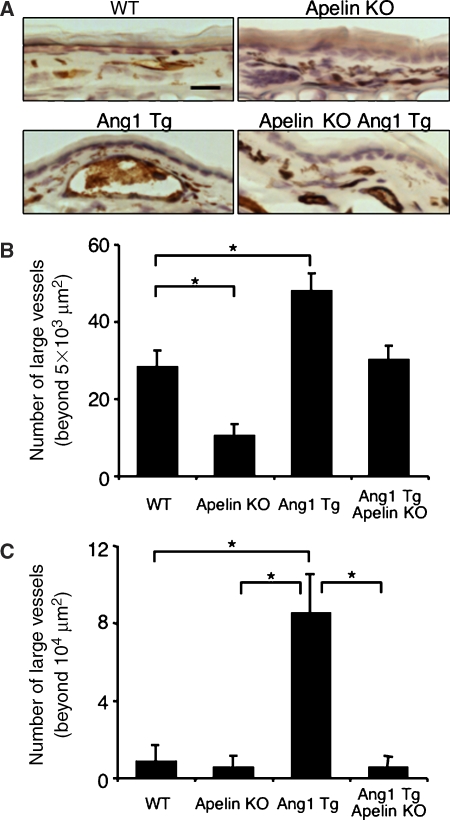
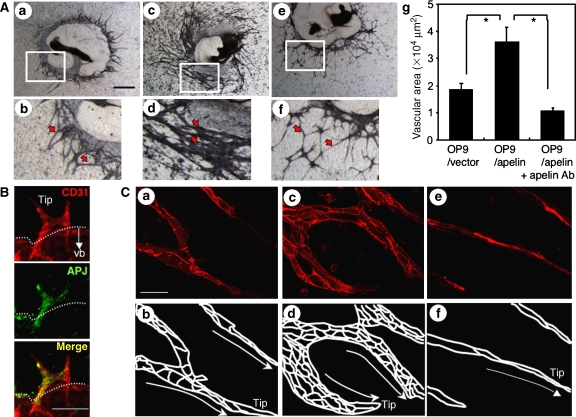
Blood vessels change their caliber to adapt to the demands of tissues or organs for oxygen and nutrients. This event is mainly organized at the capillary level and requires a size-sensing mechanism. However, the molecular regulatory mechanism involved in caliber size modification in blood vessels is not clear. Here we show that apelin, a protein secreted from endothelial cells under the activation of Tie2 receptor tyrosine kinase on endothelial cells, plays a role in the regulation of caliber size of blood vessel through its cognate receptor APJ, which is expressed on endothelial cells. During early embryogenesis, APJ is expressed on endothelial cells of the new blood vessels sprouted from the dorsal aorta, but not on pre-existing endothelial cells of the dorsal aorta. Apelin-deficient mice showed narrow blood vessels in intersomitic vessels during embryogenesis. Apelin enhanced endothelial cell proliferation in the presence of vascular endothelial growth factor and promoted cell-to-cell aggregation. These results indicated that the apelin/APJ system is involved in the regulation of blood vessel diameter during angiogenesis.


Figures

Figure 1
Figure 1
Ang1 stimulation induces apelin expression in ECs in vitro and in vivo. (A) Tie2 phosphorylation on HUVECs by Ang1 in our system. HUVECs, serum-starved for 2 h, were either treated or not treated with 500 ng/ml Ang1 for 10 min. Phosphorylation was studied by immunoblotting using phosphospecific antibody (p-Tie2). (B) Quantitative real-time RT–PCR analysis of apelin mRNA in HUVECs. Total RNA was extracted from HUVECs that had been stimulated with Ang1 for 0–22 h. Results are shown as fold increase in comparison with basal levels of HUVECs (0 h). (C) Immunocytochemical analysis of apelin expression in HUVECs, non-stimulated (a) and stimulated (b) by Ang1 (500 ng/ml) for 20 h. Cells were stained with anti-apelin mAb (green). The inset in (b) shows HUVECs stained with secondary antibody as a negative control. Nuclei were stained with propidium iodide (PI; red). Scale bar indicates 50 μm. (D) Quantitative enzyme immunoassay of apelin production from HUVECs stimulated by various doses of Ang1. *P<0.001 (n=3). (E) Immunochemical detection of apelin peptide in the dermis. Sections of skin from WT and Ang1Tg neonatal mice were stained with anti-CD31 (green) and anti-apelin (red) mAb. Arrows indicate CD31+ blood vessels. Scale bar indicates 30 μm. (F) Quantitative real-time RT–PCR analysis of apelin mRNA in ECs and hematopoietic cells (HCs) of Ang1Tg mice. RNA was prepared from sorted CD31+CD45 ECs or CD31CD45+ HCs from the dermis of WT or Ang1Tg neonatal mouse skin. *P<0.01 (n=3).
Figure 2
Figure 2
Apelin induces proliferation of HUVECs in a VEGF-dependent manner. (A) Proliferation of HUVECs by apelin. HUVECs (5 × 10³) were cultured with apelin (0–1000 ng/ml) in the presence or absence of VEGF (20 ng/ml) for 48 h and the number of cells was counted. *P<0.001 (n=3). (B) Quantitative real-time RT–PCR analysis of the induction of APJ expression by VEGF in HUVECs. HUVECs were stimulated with VEGF (10 ng/ml) for 0–18 h. Results are shown as fold increase in expression in comparison with levels in stimulated HUVECs at 0 h. *P<0.001 (n=3). (C) APJ expression on HUVECs. HUVECs were cultured in the absence (a) or presence (b, c) of VEGF (20 ng/ml) for 24 h and stained with anti-APJ antibody (green) (a, b). (c) Cells stained with a secondary antibody alone as a negative control. Nuclei were stained with propidium iodide (red). Scale bar indicates 50 μm. (D) Western blot analysis of cell surface APJ expression on HUVECs that had been stimulated with VEGF (20 ng/ml) for 24 h. The purity of cell membrane protein was confirmed by the lack of intracellular protein GAPDH expression. Claudin5 expression was analysed for the experimental control of another cell surface protein. Note that the expression of a 60 kDa APJ protein was increased in HUVECs in the presence of VEGF.
Figure 3
Figure 3
ECs from the AGM region express APJ and are induced to proliferate by apelin. (A) Quantitative real-time RT–PCR analysis of APJ expression in various tissues, as indicated. RNA from whole tissue, or CD45CD31+ ECs sorted from various tissues, was evaluated for the expression of APJ. (B) Western blot analysis of apelin expression on OP9 cells induced by mock vector (OP9/vector) or apelin expression vector (OP9/apelin). An 8 kDa apelin protein was detected in OP9/apelin. GAPDH was used for the internal control. (C) Apelin-induced proliferation of ECs from E10.5 AGM region. Cells from the AGM region were cultured for 7 days, on an OP9/vector or OP9/apelin, in the presence or absence of anti-apelin or control B220 mAb. AGM cells harvested from cultures were stained with anti-CD31 and -CD45 mAbs and analysed by FACS. (D) Quantitative evaluation of the percentage of CD31+CD45 vascular ECs cultured as described in (C). *P<0.001 (n=5).
Figure 4
Figure 4
Endothelial sheet formation by apelin. (A) Cells from E11.5 AGM region were cocultured with an OP9/vector (a) or OP9/apelin (b) for 2–6 days, and CD31 immunostaining was performed. The arrow indicates the aggregated EC sheet. Scale bar indicates 100 μm. (B) Cells from E11.5 AGM region were cocultured for 6 days with an OP9/vector (a–c), OP9/apelin in the presence of B220 control antibody (d–f) or OP9/apelin in the presence of anti-apelin blocking antibody (g–i). ECs on OP9 cells were stained with anti-CD31 (a, d, g) and anti-VE-cadherin (b, e, h) antibodies. (c, f, i) Merged images of (a) and (b), (d) and (e), or (g) and (h), respectively. Scale bar indicates 50 μm. (C) The proportion of sheet-like or cord-like structures of ECs on OP9/apelin or OP9/vector stromal cells (n=3).
Figure 5
Figure 5
Morphological change of HUVECs stimulated with apelin. (A) Cord formation analysis of HUVECs cultured on Matrigel. HUVECs were cultured in the presence of VEGF (20 ng/ml) for 20 h, harvested, transferred onto Matrigel and cultured in the absence (a) or presence of apelin (b, c) for 10 h. Anti-VE-cadherin antibody (c) or control anti-B220 mAb (b) was added. Scale bar indicates 200 μm. (d) Quantitative evaluation of the width of the cord-like structure observed in the various culture conditions (a: control; b: apelin+anti-B220 mAb; c: apelin+anti- VE-cadherin antibody) described above. The percentage of wide cord (width >15 μm) among the total cord-like structure was calculated. *P<0.01 (n=3). (B) HUVEC spheroid assay. HUVECs stimulated with VEGF for 24 h were harvested and cultured on nonadhesive dishes in the absence (a) or presence of apelin (b, c) for 10 h. Anti-apelin antibody (c) or control anti-B220 mAb (b) was added. Scale bar indicates 500 μm. The inset in each panel shows higher magnified representative spheroid under each condition. (d) Quantitative evaluation of the size of spheroid observed in the various culture conditions (a: control; b: apelin; c: apelin+anti-apelin antibody) described above. The percentage of large spheroid (diameter >200 μm) among the total spheroid was calculated. *P<0.01 (n=3).
Figure 6
Figure 6
Expression of APJ in embryo. (A) Whole-mount staining of E8.5 mouse embryo with anti-CD31 (red) and anti-APJ (green) antibodies. (B) Staining of E9.5 mouse embryo section with anti-CD31 (red) and anti-APJ (green) Abs. The left panel shows high-power view of the area indicated by the box. Note that the DA stained by anti-CD31 Ab did not express APJ and APJ expressed on ECs sprouting from DA. Scale bar indicates 500 μm.
Figure 7
Figure 7
Defect of the enlargement in blood vessel caliber in apelin-deficient mice. (A) Whole-mount immunohistostaining of WT (a, b) and apelin-deficient (c, d) embryos at E9.5 with anti-CD31 Ab. (b) and (d) are higher magnifications of the areas indicated by the box in (a) and (c), respectively. Scale bar indicates 300 μm. (B) Sections containing ISVs (arrowheads) from WT and apelin-deficient (KO) embryos at E9.5 were stained with anti-CD31 antibody. The level of the sectioning position is indicated by a white bar in (b) and (d). Scale bar indicates 30 μm. (C) Quantitative evaluation of the vascular diameter of intersomitic blood vessels from apelin-deficient (KO) versus WT mice. *P<0.001 (30 vessels from 5 embryos were examined). Details of the measurement of vascular diameter are shown in Supplementary Figure 7. (D) Representative pictures of microvessels sprouted from aortic ring using apelin-deficient mice. Aortic ring was cultured in the presence or absence of VEGF (10 ng/ml) or apelin (100 ng/ml). PBS was used as a negative control. Pictures in the right panel show a high-power view of the area indicated by the box, respectively. Scale bar indicates 300 μm. (E) Quantitative evaluation of the vascular size of sprouted microvessels from the aortic ring cultured as described in (D). Vascular size was measured as the length between two parallel lines as indicated in (D). *P<0.003 (n=30).
Figure 8
Figure 8
Lectin staining of tracheal blood vessels. (A–D) Comparison of tracheal blood vessels in 8-week-old WT (A, B) and apelin-deficient (C, D) mice stained by intravenous injection of fluorescein-labelled lectin. a in (C) means avascular area. (B) and (D) show a high-power view of the area indicated by the box in (A) and (C), respectively. Scale bar in (C) indicates 200 μm (A, C) and 60 μm (B, D). (E) Quantitative evaluation of vascular density from apelin-deficient (KO) versus WT mice. *P<0.001. Vascular density from 10 random fields was counted. (F) Quantitative evaluation of vascular size of blood vessels in the trachea from apelin-deficient (KO) versus WT mice. Vascular size was measured as the length between two parallel red lines as indicated in (B) and (D). *P<0.001 (100 vessels from 3 mice were examined).
Figure 9
Figure 9
Apelin/APJ system is involved in Ang1-induced vascular enlargement. (A) Sections of ear skin stained with anti-CD31 mAb. Ear skin was prepared from 8-week-old WT, apelin-deficient (apelin KO), Ang1Tg mice, or apelin-deficient mice mated with Ang1Tg mice (apelin KO/Ang1 Tg). Scale bar indicates 30 μm. (B, C) Quantitative evaluation of the number of enlarged blood vessels composed of a luminal cavity of more than 5000 μm2 (B) or more than 104 μm2 (C) in the skin from mice as described in (A). Thirty random fields were observed from sections of three independent mice as described in (A). *P<0.01.
Figure 10
Figure 10
Effect of apelin on the P-Sp culture system. (A) Effect of apelin on the network-like structure of ECs in the P-Sp culture system. P-Sp explants from E9.5 mouse embryos were cultured for 7 days on OP9/vector (a, b) or OP9/apelin, in the presence of B220 control mAbs (c, d) or anti-apelin mAbs (e, f), and then stained with anti-CD31 mAb. (b), (d) and (f) are higher magnifications of areas indicated by the box in (a), (c) and (e), respectively. Arrows indicate network-forming ECs. Scale bar indicates 1 mm (a, c, e) or 200 μm (b, d, f). (g) Quantitative evaluation of the vascular network area cultured as above. Endothelial space per 500 μm length of network-forming ECs was measured in 10 random fields. *P<0.001. (B) Expression of APJ in ECs of P-Sp culture. Cells on culture plates were stained with anti-CD31 (red) and anti-APJ (green) antibodies. Tip, tip EC. Dotted line indicates the border of the vascular bed (vb). Note APJ expressed on ECs forming a network-like structure. Scale bar indicates 100 μm. (C) Network-forming ECs derived from P-Sp explants cultured on OP9/vector (a, b), OP9/apelin in the presence of control B220 mAbs (c, d) or OP9/apelin in the presence of anti-apelin mAbs (e, f) for 7 days were stained with anti-VE-cadherin (red) mAbs. Scale bar indicates 20 μm. Because nuclear staining cannot distinguish the nuclei of ECs from those of OP9 cells, only VE-cadherin expression was revealed. Therefore, the EC-to-EC boundary expressed by VE-cadherin is presented (b, d, f). Tip, tip EC. Migration direction of tip EC is indicated by the arrow.

Similar articles

Cited by

References

    1. Adams RH, Wilkinson GA, Weiss C, Diella F, Gale NW, Deutsch U, Risau W, Klein R (1999) Roles of ephrinB ligands and EphB receptors in cardiovascular development: demarcation of arterial/venous domains, vascular morphogenesis, and sprouting angiogenesis. Genes Dev 13: 295–306 - PMC - PubMed
    1. Ashley EA, Powers J, Chen M, Kundu R, Finsterbach T, Caffarelli A, Deng A, Eichhorn J, Mahajan R, Agrawal R, Greve J, Robbins R, Patterson AJ, Bernstein D, Quertermous T (2005) The endogenous peptide apelin potently improves cardiac contractility and reduces cardiac loading in vivo. Cardiovasc Res 65: 73–82 - PMC - PubMed
    1. Carmeliet P (2003) Angiogenesis in health and disease. Nat Med 9: 653–660 - PubMed
    1. Cho CH, Kim KE, Byun J, Jang HS, Kim DK, Baluk P, Baffert F, Lee GM, Mochizuki N, Kim J, Jeon BH, McDonald DM, Koh GY (2005) Long-term and sustained COMP-Ang1 induces long-lasting vascular enlargement and enhanced blood flow. Circ Res 97: 86–94 - PubMed
    1. Cox CM, D'Agostino SL, Miller MK, Heimark RL, Krieg PA (2006) Apelin, the ligand for the endothelial G-protein-coupled receptor, APJ, is a potent angiogenic factor required for normal vascular development of the frog embryo. Dev Biol 296: 177–189 - PubMed

Publication types

MeSH terms