. 2008 Jan 23;27(2):433-46.
doi: 10.1038/sj.emboj.7601963. Epub 2008 Jan 17.

Fission and selective fusion govern mitochondrial segregation and elimination by autophagy

Affiliations

Fission and selective fusion govern mitochondrial segregation and elimination by autophagy

Gilad Twig et al. EMBO J. .

Abstract

Accumulation of depolarized mitochondria within beta-cells has been associated with oxidative damage and development of diabetes. To determine the source and fate of depolarized mitochondria, individual mitochondria were photolabeled and tracked through fusion and fission. Mitochondria were found to go through frequent cycles of fusion and fission in a 'kiss and run' pattern. Fission events often generated uneven daughter units: one daughter exhibited increased membrane potential (delta psi(m)) and a high probability of subsequent fusion, while the other had decreased membrane potential and a reduced probability for a fusion event. Together, this pattern generated a subpopulation of non-fusing mitochondria that were found to have reduced delta psi(m) and decreased levels of the fusion protein OPA1. Inhibition of the fission machinery through DRP1(K38A) or FIS1 RNAi decreased mitochondrial autophagy and resulted in the accumulation of oxidized mitochondrial proteins, reduced respiration and impaired insulin secretion. Pulse chase and arrest of autophagy at the pre-proteolysis stage reveal that before autophagy mitochondria lose delta psi(m) and OPA1, and that overexpression of OPA1 decreases mitochondrial autophagy. Together, these findings suggest that fission followed by selective fusion segregates dysfunctional mitochondria and permits their removal by autophagy.


Figures
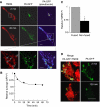
Figure 1
Figure 1
A subset of mitochondria have reduced fusion capacity. (A) INS1 cells were transduced with mtPA-GFP (green) and stained with TMRE (red). mtPA-GFP distribution is shown immediately (within 2 min) after photoactivation (area indicated by a dashed square) and in the plateau phase of mtPA-GFP spreading (45 min). Mitochondria that did not exhibit GFP FI decay (less than 5%) are marked by arrows. Upper scale bar, 10 μm; lower scale bar 5 μm. (B) Fusion events result in the spread of mtPA-GFP across the mitochondrial population, leading to its dilution and a decay in GFP FI value (n=16). (C) The relative difference in TMRE FI between non-fusing mitochondria and fusing mitochondria, calibrated against the whole-cell average. (D) Primary β-cells expressing mtPA-GFP were photoactivated in seven different regions (squares) and imaged after 2 min and again after 2 h of incubation. Scale bar, 10 μm. *P<0.001.
Figure 2
Figure 2
Tracking individual mitochondria over time reveals that fusion and fission are paired. (A) An INS1 cell expressing mtPA-GFP and co-labeled with TMRE. The two mitochondria fused 20 s after photoactivation (arrow in ‘20 s'). Then, a voltage difference was established between the two poles (60–120 s) and they were later physically separated (120 s). The pattern is qualitatively similar to that shown in Figure 3Bi. Scale bar, 2 μm. (B) Fusion and fission time chart for individual mitochondria. Individual mitochondria tagged with mtPA-GFP were monitored for a period of 1 h and the occurrence of fusion and fission was recorded. Mitochondria in INS1 and COS7 cells spend 77s (±71 s) and 87 s (±78 s), respectively, in the post-fusion, connected state, and an average of 1434s and 1172 s, respectively, in the solitary, post-fission state. (C) Fusion triggers fission. Cumulative probability of the occurrence of fission events at different intervals after fusion events occur (fraction of all fission events occurring after the given time interval). The data are fit to a hyperbolic function representing linkage between the two events (INS1, R2=0.98; COS7, R2=0.96). The straight line shows the predicted linear growth rate in fission event probability over time that would be expected if the fission had occurred independently from the fusion events (dashed lines INS1, R2=0.77; COS7, R2=0.84; see Supplementary data). (D) Fission does not trigger fusion. Cumulative probability of the occurrence of fusion events at different intervals after the fission event occurred. The data points were fitted to a linear relationship (R2=0.92), as predicted if fusion occurred independently of fission (0.05 versus 0.06%/second, respectively; see Supplementary data).
Figure 3
Figure 3
Metabolic outcomes of single fission events. (A) Mitochondrial fission in a COS7 cell yields two daughter mitochondria with a ∼28% difference in TMRE/GFP FI ratio (∼Δ=9 mV). The relative GFP FI change was minimal (Δ=3.4%). For clarity the pseudocolored ratios before fission at 60 and 160 s after fission are shown. Scale bar, 2 μm. (B) Chart of Δψm over time for typical fission events; (i) fission results in temporary depolarization of one unit, (ii) fission results in permanent depolarization of one unit, (iii) fission results in the generation of a hyperpolarized daughter mitochondrion and a mitochondrion of the pre-fission potential. (C) Average Δψm before (left, gray) and after fission (right, filled and empty circles denote depolarized and hyperpolarized mitochondria respectively). Only fission events where Δψm of both mitochondria could be continuously tracked are included (n=7).
Figure 4
Figure 4
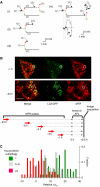
Consequences of fusion–fission events. (A) Schematic illustrations of mitochondrial tracking in four different experiments (i–iv) and corresponding Δψm traces (iv). Colored arrows indicate generation of hyperpolarizing (red) and depolarizing (green) daughters during fission. Note that after a fission event, fusion (black arrows) preferably occurred in the hyperpolarized daughter mitochondrion. (B) Depolarized mitochondria are selectively targeted for autophagy after a multi-hour time lag. APs are labeled with LC3:GFP, which translocates from the cytosol to the AP's isolation membrane. MTR, a membrane potential dye that stains mitochondria irreversibly and is retained during depolarization, is used to pulse label mitochondria in INS1 cells (14 min, 50 nM) at different time points before detection of APs content. At the time set for detection, cells were treated with pepstatin A (10 μM) and E64d (10 μM) for 30 min to arrest digestion inside the APs, and then subjected to confocal microscopy (see schematic illustration of the Materials and methods). MTR pulse is used here to report on Δψm during the staining period. While mitochondria outside APs show bright MTR fluorescence, those localized in APs varied in fluorescence based on the time at which they were pulsed with MTR. Note that mitochondria inside APs have dim MTR FI if they were pulsed with MTR 1 h before autophagy was detected (circle, top panel), but bright MTR FI if pulsed 24 h before detection of autophagy (circle, bottom panel). Scale bar, 10 μm. (C) Distribution of MTR FI (given in Δψm) of AP-localized mitochondria at different times before autophagy. Values are relative to cell's average MTR FI. In the x-axis, a zero value represents the average Δψm and positive values represent depolarized mitochondria.
Figure 5
Figure 5
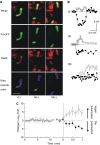
Reduced OPA1 levels in non-fusing mitochondria and mitochondria inside APs. (A) Relative immunofluorescence of OPA1 in INS1 cell mitochondria correlates to their fusion capacity. Cells (n=6) were photoactivated (∼10–15% of cell mitochondrial mass) and then returned to the incubator for 2 h before fixation. Based on their ability to share and thereby dilute the photoconverted mtPA-GFP, mitochondria were classified as fused (n=54) in which GFP FI was lower than 2 times the average and non-fused (n=10) in which GFP FI was at least 200% above the average (in the same manner as described for Figure 1). In each cell, OPA1 FI of non-fused mitochondria was normalized to that of mitochondria that had diluted mtPA-GFP through fusion. OPA1 FI is reduced in non-fusing mitochondria (P=0.003). A set of FI-coded images of mtPA-GFP, mtDsRed and OPA1 immunostaining are shown. Scale bar, 2 μm. (B) OPA1 FI, but not mtDsRed FI, is reduced in mitochondria undergoing autophagy. INS1 cells expressing mtDsRed and LC3:GFP were treated with 0.2 μM bafilomycin (45 min) or a cocktail of pepstatin A and E64d (90 min) and fixed. Mitochondria inside APs were defined by colocalization of mtDsRed and LC3:GFP. OPA1 FI in APs was normalized to its FI in mitochondria that were located outside APs (organelles positive for mtDsRed with subthreshold GFP FI). OPA1 FI within APs was 50% (*P<0.001) and 54% (**P=0.003) upon treatment with bafilomycin or a cocktail of pepstatin A and E64d, respectively. Mitochondria inside APs had similar (96%) mtDsRed FI to those located outside APs (P=0.47). Scale bar, 2 μm. (C) The effect of OPA1 overexpression on the number of AP-containing mitochondria. Imaging of INS1 cells already expressing LC3:GFP and mtDsRed was performed 48–72 h after adenoviral transduction with either OPA1 overexpression or control (mitoPA-GFP). The number of AP-containing mitochondria in the OPA1 overexpression (OE, n=6) was normalized to the control (*P=0.001). Images show representative cells from each group. Red, mtDsRed; green, LC3:GFP. In the control cell, note the colocalization of APs with mitochondria. Scale bar, 10 μm.
Figure 6
Figure 6
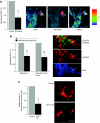
Inhibition of fission attenuates mitochondria-specific autophagy (mitophagy). (A) Confocal images of FIS1 RNAi, DRP1-DN and control cells coexpressing the AP marker LC3:GFP (green), and stained with MTR (red, control and FIS1 RNAi group) or mtDsRed (red, DRP1-DN) and treated with pepstatin A and E64d to arrest digestion in late APs. A magnified area within a FIS1 RNAi cell shows APs with and without mitochondria (white and blue circles respectively). Scale bar, 5 μm. (B) Quantitative analysis of AP-containing mitochondria in INS1 cells expressing FIS1 RNAi or DRP1-DN. In each group the number of AP-containing mitochondria was normalized to its control and found to be significantly different (*P<0.001; **P<0.001). (C) Altering fission does not impair ER autophagy and AP or lysosomal mass. INS1 cells expressing LC3:GFP were stained with ER Tracker to assess AP-containing ER. The number of AP-containing ER was not significantly different between control and FIS1 RNAi cells (P=0.51; n=11). Lysosensor stain (75 nM, 30 min) reveals no difference between control and FIS1 RNAi cells (P=0.21). The total AP number in DRP1-DN cells is similar to that of the control (n=11, P=0.53).
Figure 7
Figure 7
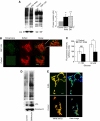
Inhibition of fission or autophagy results in increased protein oxidative damage. (A) Level of oxidized mitochondrial protein in mitochondria purified from FIS1 RNAi (n=3), DRP1-DN (n=4) and their respective control cells. The blot detects carbonyl groups on amino-acid side chains (Oxiblot analysis, see Materials and methods). Loading control CIII, mitochondrial ComplexIII Core I (*P<0.03, **P<0.04). (B) COS7 cells coexpressing DRP1-DN and mtDsRed (red) were fixed, permeabilized and stained with a monoclonal antibody against nitrotyrosine (green). Control cells were infected with mtPA-GFP lentivirus. DRP1-DN cells show increased nitrotyrosine immunoreactivity in mitochondria, particularly in the distal and enlarged ends. Scale bar, 15 μm (see also Supplementary Figure S9). (C) Knockdown of FIS1 does not increase ROS production. ROS production in FIS1 RNAi and control cells as measured by DHE FI under different glucose levels. Cells were loaded with dye and FI was measured before and 10 min after changing of glucose concentration (NS, non-significant; P=0.5; *P<0.001). (D) Inhibition of autophagy results in increased protein oxidative damage. Treatment of INS1 cells with bafilomycin (blocking autophagy by preventing fusion with lysosomes, 0.1 μM for 3 h) results in the accumulation of oxidized proteins in mitochondria, which is shown by increased level of carbonylated amino acids in isolated mitochondria. (E) Inhibition of autophagy generates Δψm heterogeneity. INS1 cells were treated with 3-MA (2 mM for 5 days) and then stained with TMRE and mitotracker green. Ratio image of red/green represents Δψm and is shown in pseudocolor where depolarized mitochondria appear blue. Note the increase in subcellular Δψm heterogeneity and the appearance of depolarized units with low TMRE (see also Supplementary Figure S4A–C). Scale bar, 5 μm.
Figure 8
Figure 8
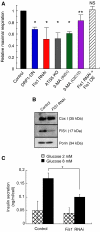
Altered metabolism accompanies decreased fission and autophagy. (A) FIS1 and DRP1 knockdown reduced maximal respiratory chain capacity in FIS1 RNAi and DRP1-DN compared with their control (n=4 in each group; glucose=11 mM). Inhibition of autophagy by 3-MA in INS1 cells (2 mM, 5 days, n=4) and C2C12 cells (1 mM, 5 days, n=4) showed significant decrease in respiratory capacity. ATG5-deficient MEF cells (n=4) had significantly decreased respiratory capacity compared with control MEF cells. Maximal respiration was tested using 5 μM FCCP or 100 μM DNP (*P<0.001, **P<0.04). (B) Expression of mtDNA-encoded subunit I of cytochrome oxidase (COX I) in INS1 cells infected with FIS1 RNAi and control RNAi lentiviruses and tested after 1 week. (C) GSIS in FIS1 RNAi and control RNAi cells (n=5 for each column, *P<0.05). Values are normalized to number of cells in each well and represent 30 min stimulation.
Figure 9
Figure 9
A model of the mitochondrion's life cycle that integrates mitochondrial dynamics and turnover. The mitochondrion cyclically shifts between a post fusion state (network) and a post fission state (solitary). Fusion is brief and triggers fission. Following a fission event, the daughter mitochondrion may either maintain intact membrane potential (red line) or depolarize (green line). If it depolarizes, it is unlikely to proceed to a subsequent fusion, unless it re-polarizes. After being depolarized and solitary for a few hours, the mitochondrion is removed by autophagy.

Similar articles

Cited by

References

    1. Alavi MV, Bette S, Schimpf S, Schuettauf F, Schraermeyer U, Wehrl HF, Ruttiger L, Beck SC, Tonagel F, Pichler BJ, Knipper M, Peters T, Laufs J, Wissinger B (2007) A splice site mutation in the murine Opa1 gene features pathology of autosomal dominant optic atrophy. Brain 130: 1029–1042 - PubMed
    1. Arimura S, Yamamoto J, Aida GP, Nakazono M, Tsutsumi N (2004) Frequent fusion and fission of plant mitochondria with unequal nucleoid distribution. Proc Natl Acad Sci USA 101: 7805–7808 - PMC - PubMed
    1. Barsoum MJ, Yuan H, Gerencser AA, Liot G, Kushnareva Y, Graber S, Kovacs I, Lee WD, Waggoner J, Cui J, White AD, Bossy B, Martinou JC, Youle RJ, Lipton SA, Ellisman MH, Perkins GA, Bossy-Wetzel E (2006) Nitric oxide-induced mitochondrial fission is regulated by dynamin-related GTPases in neurons. EMBO J 25: 3900–3911 - PMC - PubMed
    1. Chan DC (2006) Mitochondria: dynamic organelles in disease, aging, and development. Cell 125: 1241–1252 - PubMed
    1. Chen H, Chomyn A, Chan DC (2005) Disruption of fusion results in mitochondrial heterogeneity and dysfunction. J Biol Chem 280: 26185–26192 - PubMed

Publication types

MeSH terms