Comparative Study
. 2008 Feb;38(2):350-63.
doi: 10.1002/eji.200737768.

Polyfunctional T cell responses are a hallmark of HIV-2 infection

Affiliations
Comparative Study

Polyfunctional T cell responses are a hallmark of HIV-2 infection

Melody G Duvall et al. Eur J Immunol. 2008 Feb.

Abstract

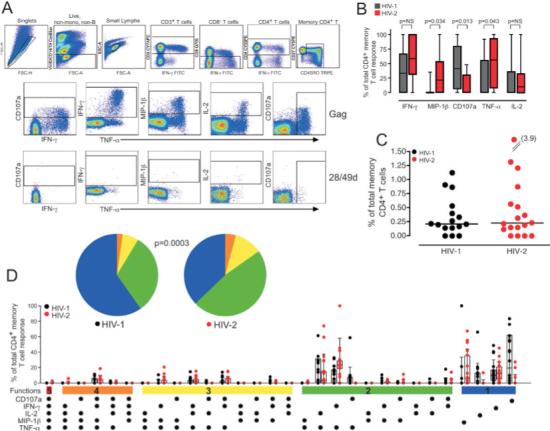
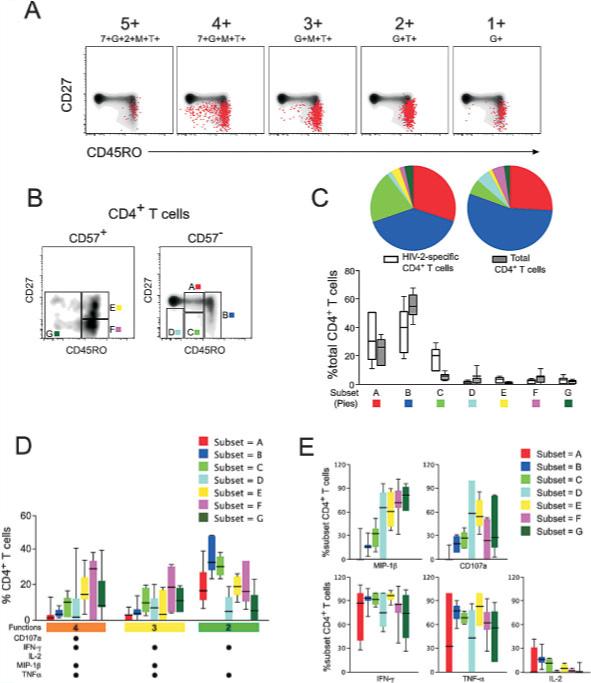
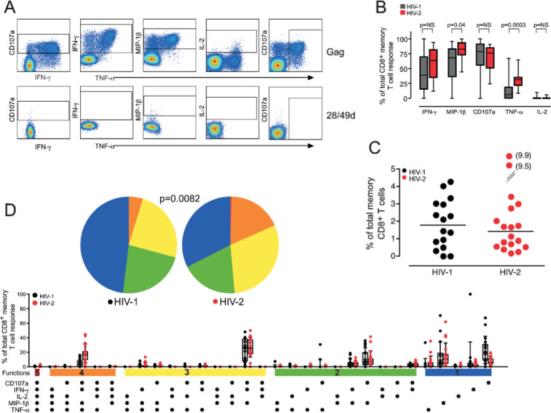
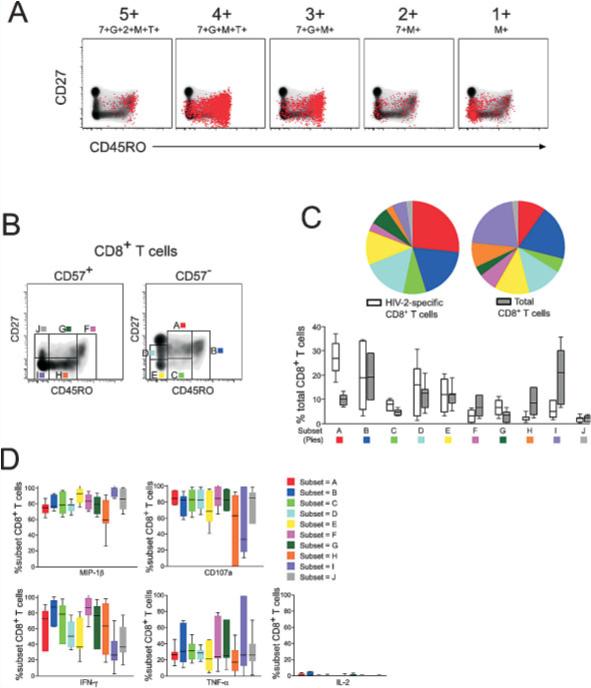
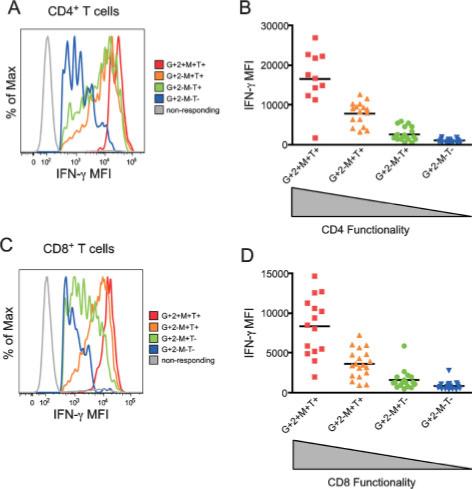
HIV-2 is distinguished clinically and immunologically from HIV-1 infection by delayed disease progression and maintenance of HIV-specific CD4(+) T cell help in most infected subjects. Thus, HIV-2 provides a unique natural human model in which to investigate correlates of immune protection against HIV disease progression. Here, we report a detailed assessment of the HIV-2-specific CD4(+) and CD8(+) T cell response compared to HIV-1, using polychromatic flow cytometry to assess the quality of the HIV-specific T cell response by measuring IFN-gamma, IL-2, TNF-alpha, MIP-1beta, and CD107a mobilization (degranulation) simultaneously following Gag peptide stimulation. We find that HIV-2-specific CD4(+) and CD8(+) T cells are more polyfunctional that those specific for HIV-1 and that polyfunctional HIV-2-specific T cells produce more IFN-gamma and TNF-alpha on a per-cell basis than monofunctional T cells. Polyfunctional HIV-2-specific CD4(+) T cells were generally more differentiated and expressed CD57, while there was no association between function and phenotype in the CD8(+) T cell fraction. Polyfunctional HIV-specific T cell responses are a hallmark of non-progressive HIV-2 infection and may be related to good clinical outcome in this setting.


Figures

Figure 1
Figure 1
Polyfunctional HIV-specific CD4+ T cells are prominent in HIV-2. (A) Representative gating scheme for identification of HIV Gag-specific CD4+ T cell responses is shown for single HIV-2-infected individual. Gates for each of the five functions were set based on the negative control (28/49d sample) for each individual. (B) The proportion of the total HIV-specific memory CD4+ T cell response contributed by each function is shown with boxes representing medians and interquartile ranges in 16 HIV-1 (grey) and 18 HIV-2 (red) subjects. Differences were assessed by Mann-Whitney U test and p values are shown. NS = not significant. (C) The magnitude of the total HIV Gag-specific memory CD4+ T cell response was calculated based on the summation of all individual functional response patterns. The median line is shown. (D) The functional complexity of the HIV-specific CD4+ T cells response was assessed by analyzing the individual response patterns. The x-axis displays each response pattern, whose composition is denoted with a dot for the presence of CD107a, IFN-γ, IL-2, MIP-1β, and TNF-α. The proportion of the total memory CD4+ T cell response contributed by each response pattern for each individual and the median and interquartile ranges are shown. The response patterns are grouped and color-coded by number of positive functions and summarized in pie chart form where each pie slice represents the mean proportion of the total CD4+ T cell response contributed by response patterns that have all five (red) or any combination of four (orange), three (yellow), two (green), or one (blue) of the measured functions.
Figure 2
Figure 2
Association between function and phenotype in HIV-2-specific CD4+ T cells. (A) Surface phenotype of HIV-2-specific CD4+ T cells in shown for representative functional populations (5+:7+G+2+M+T+; 4+:7+G+M+T+; 3+:G+M+T+; 2+:G+T+; 1+:G+) in a single HIV-2 subject by overlaying responding cells (red dots) on a density plot of total CD4+ T cells, showing CD27 and CD45RO expression. (B) Further phenotype analysis incorporated CD57 expression and responding cells were divided into seven phenotypic subsets (A–G). (C) The distribution of total peripheral CD4+ T cells (grey bars) or HIV-2-specific CD4+ T cells (white bars) among the seven phenotypic subsets was examined in six HIV-2+ individuals. The proportion of CD4+ T cells that fell within each phenotypic subset is shown with boxes representing medians and interquartile ranges. These data are summarized in color-coded pie chart form where each pie slice represents the mean proportional contribution of each subset to the total. (D) The phenotypic distribution of cells with a given functional profile was examined. The relative contribution to a 4+,3+, and 2+ functional population was examined for each of the seven phenotypic subsets. Median and interquartile ranges are shown. (E) The functional profile of each phenotypic subset is shown. For each phenotype, the proportion of cells producing a given function is shown with median and interquartile ranges; 7 = CD107a; G = IFN-γ; 2 = IL-2; M = MIP-1β; T = TNF-α.
Figure 3
Figure 3
HIV-2-specific CD8+ T cells express multiple effector functions. (A) HIV-specific CD8+ T cell responses were assessed using the same five functions as for CD4+ T cell responses (CD107a, IFN-γ, MIP-1β, IL-2, and TNF-α). Gates for each function were set based on the negative control sample for each individual and are shown for a single HIV-2+ subject. (B) The proportion of the total HIV-specific CD8+ T cell response contributed by each of the five functions was assessed in 16 HIV-1+ and 18 HIV-2+ subjects and is reported as single function frequency divided by the frequency of the total response. Medians and interquartile ranges are shown. Differences were assessed by Mann-Whitney U test and p values are shown. NS = not significant. (C) The magnitude of the total memory CD8+ T cell response was calculated by summing all individual response patterns (median line is shown). (D) All possible response patterns were analyzed for proportional contribution to the total Gag-specific CD8+ T cell response and data are displayed as in Fig. 1D.
Figure 4
Figure 4
No association between function and phenotype in HIV-2-specific CD8+ T cells. (A) Surface phenotype of HIV-2-specific CD8+ T cells in shown for representative functional populations (5+:7+G+2+M+T+; 4+:7+G+M+T+; 3+:7+G+M+; 2+:7+M+; 1+:M+)in a single HIV-2 subject by overlaying responding cells (red dots) on a density plot of total CD8+ T cells, showing CD27 and CD45RO expression. (B) Further phenotype analysis incorporated CD57 expression and responding cells were divided into ten phenotypic subsets (A–J). (C) The distribution of total peripheral CD8+ T cells or HIV-2-specific CD8+ T cells among the ten phenotypic subsets was examined in six HIV-2+ individuals. These data are displayed as in Fig. 2C. (D) No association between functionality and stage of phenotypic differentiation was observed in the CD8+ T cell fraction. The functional profile of each of the ten phenotypic subsets was similar. For each phenotype, the proportion of cells producing a given function is shown with median and interquartile ranges; 7 = CD107a; G = IFN-γ; 2 = IL-2; M = MIP-1β; T = TNF-α.
Figure 5
Figure 5
Polyfunctional T cells produce more cytokine than monofunctional cells. (A) Median fluorescent intensity (MFI) for each function was calculated for the dominant HIV-2-specific CD4+ T cell populations. IFN-γ MFI for each functional population is shown as a histogram and color-coded according to the number of positive functions. Data from a single HIV-2-infected individual are shown and is representative of 17 additional HIV-2+ subjects. (B) IFN-γ MFI data was compiled for 18 HIV-2+ individuals for each functional population. IFN-γ MFI was highest among the most polyfunctional populations, and lowest among monofunctional cells. Median IFN-γ MFI for each population is shown. (C) IFN-γ MFI for dominant HIV-2-specific CD8+ T cell responses are shown as histograms in a single HIV-2+ subject as in (A). (D) IFN-γ MFI data was compiled for 18 HIV-2+ subjects. Median IFN-γ MFI for each population is shown; 7 = CD107a; G = IFN-γ; 2 = IL-2; M = MIP-1β; T = TNF-α.

Similar articles

Cited by

References

    1. Poulsen AG, Aaby P, Larsen O, Jensen H, Naucler A, Lisse IM, Christiansen CB, et al. 9-year HIV-2-associated mortality in an urban community in Bissau, West Africa. Lancet. 1997;349:911–914. - PubMed
    1. Schim van der Loeff MF, Jaffar S, Aveika AA, Sabally S, Corrah T, Harding E, Alabi A, et al. Mortality of HIV-1, HIV-2 and HIV-1/HIV-2 dually infected patients in a clinic-based cohort in The Gambia. Aids. 2002;16:1775–1783. - PubMed
    1. Ariyoshi K, Jaffar S, Alabi AS, Berry N, Schim van der Loeff M, Sabally S, N'Gom PT, et al. Plasma RNA viral load predicts the rate of CD4 T cell decline and death in HIV-2-infected patients in West Africa. Aids. 2000;14:339–344. - PubMed
    1. Berry N, Jaffar S, Schim van der Loeff M, Ariyoshi K, Harding E, N'Gom PT, Dias F, et al. Low level viremia and high CD4% predict normal survival in a cohort of HIV type-2-infected villagers. AIDS Res. Hum. Retroviruses. 2002;18:1167–1173. - PubMed
    1. Ariyoshi K, Berry N, Wilkins A, Ricard D, Aaby P, Naucler A, Ngom PT, et al. A community-based study of human immunodeficiency virus type 2 provirus load in rural village in West Africa. J. Infect. Dis. 1996;173:245–248. - PubMed

Publication types

MeSH terms