

Role of the cAMP sensor Epac as a determinant of KATP channel ATP sensitivity in human pancreatic beta-cells and rat INS-1 cells
- PMID: 18202100
- PMCID: PMC2375670
- DOI: 10.1113/jphysiol.2007.143818
Role of the cAMP sensor Epac as a determinant of KATP channel ATP sensitivity in human pancreatic beta-cells and rat INS-1 cells
Abstract
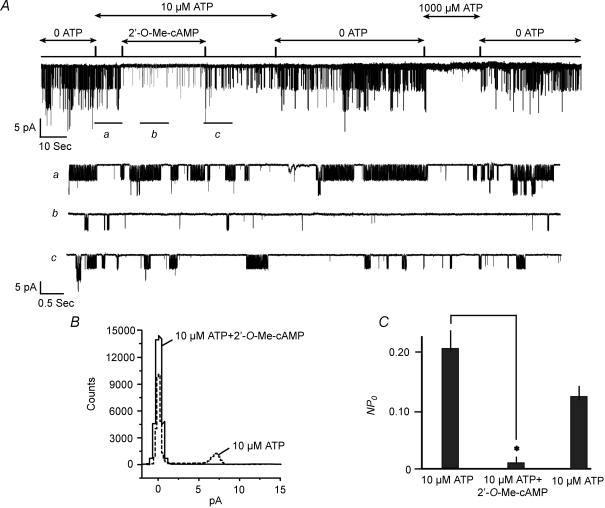
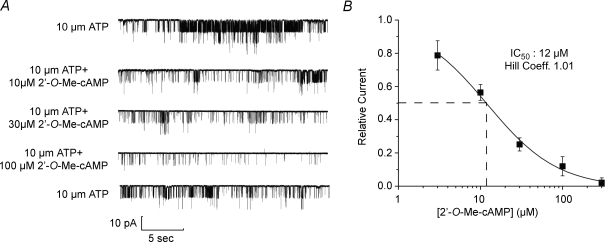
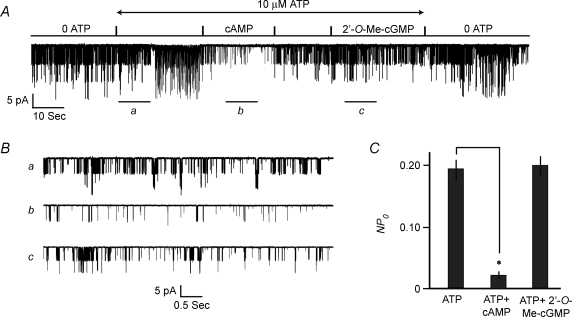
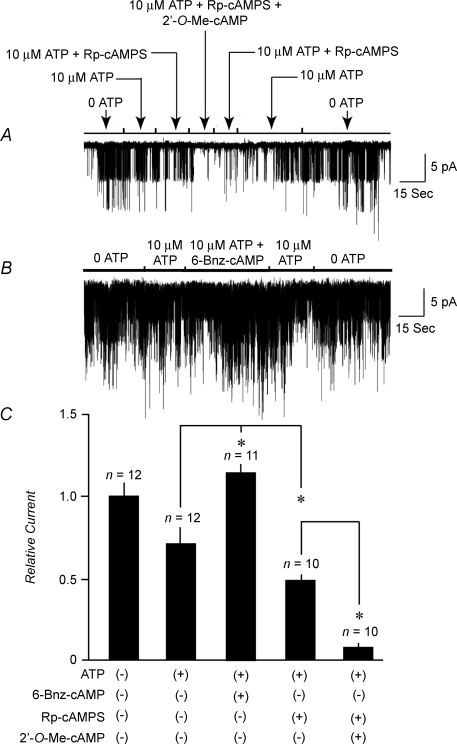
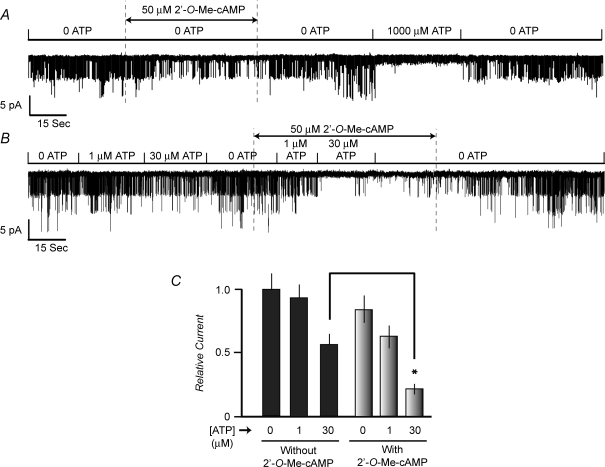
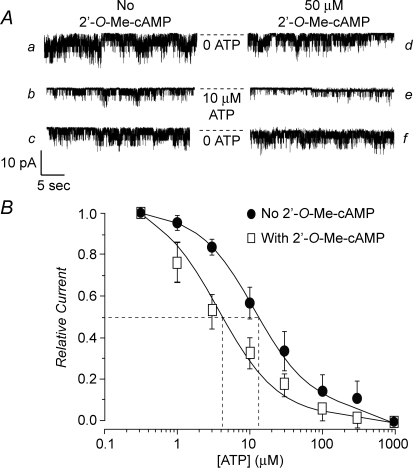
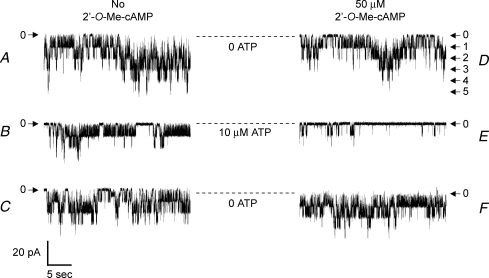
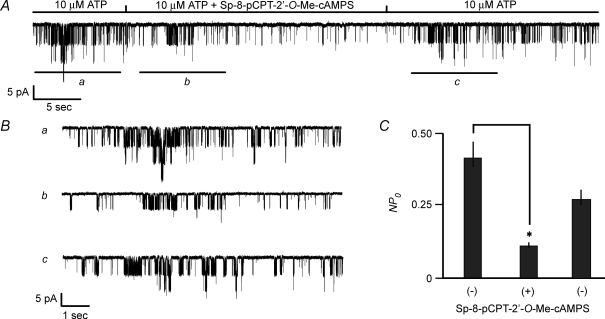
Protein kinase A (PKA)-independent actions of adenosine 3',5'-cyclic monophosphate (cAMP) are mediated by Epac, a cAMP sensor expressed in pancreatic beta-cells. Evidence that Epac might mediate the cAMP-dependent inhibition of beta-cell ATP-sensitive K(+) channels (K(ATP)) was provided by one prior study of human beta-cells and a rat insulin-secreting cell line (INS-1 cells) in which it was demonstrated that an Epac-selective cAMP analogue (ESCA) inhibited a sulphonylurea-sensitive K(+) current measured under conditions of whole-cell recording. Using excised patches of plasma membrane derived from human beta-cells and rat INS-1 cells, we now report that 2'-O-Me-cAMP, an ESCA that activates Epac but not PKA, sensitizes single K(ATP) channels to the inhibitory effect of ATP, thereby reducing channel activity. In the presence of 2'-O-Me-cAMP (50 microM), the dose-response relationship describing ATP-dependent inhibition of K(ATP) channel activity (NP(o)) is left-shifted such that the concentration of ATP producing 50% inhibition (IC(50)) is reduced from 22 microM to 1 microM for human beta-cells, and from 14 microM to 4 microM for rat INS-1 cells. Conversely, when patches are exposed to a fixed concentration of ATP (10 microM), the administration of 2'-O-Me-cAMP inhibits channel activity in a dose-dependent and reversible manner (IC(50) 12 microM for both cell types). A cyclic nucleotide phosphodiesterase-resistant ESCA (Sp-8-pCPT-2'-O-Me-cAMPS) also inhibits K(ATP) channel activity, thereby demonstrating that the inhibitory actions of ESCAs reported here are unlikely to arise as a consequence of their hydrolysis to bioactive derivatives of adenosine. On the basis of such findings it is concluded that there exists in human beta-cells and rat INS-1 cells a novel form of ion channel modulation in which the ATP sensitivity of K(ATP) channels is regulated by Epac.
Figures
Similar articles
-
cAMP sensor Epac as a determinant of ATP-sensitive potassium channel activity in human pancreatic beta cells and rat INS-1 cells.J Physiol. 2006 Jun 15;573(Pt 3):595-609. doi: 10.1113/jphysiol.2006.107391. Epub 2006 Apr 13. J Physiol. 2006. PMID: 16613879 Free PMC article.
-
Facilitation of ß-cell K(ATP) channel sulfonylurea sensitivity by a cAMP analog selective for the cAMP-regulated guanine nucleotide exchange factor Epac.Islets. 2010 Mar-Apr;2(2):72-81. doi: 10.4161/isl.2.2.10582. Islets. 2010. PMID: 20428467 Free PMC article.
-
Enhanced Rap1 activation and insulin secretagogue properties of an acetoxymethyl ester of an Epac-selective cyclic AMP analog in rat INS-1 cells: studies with 8-pCPT-2'-O-Me-cAMP-AM.J Biol Chem. 2009 Apr 17;284(16):10728-36. doi: 10.1074/jbc.M900166200. Epub 2009 Feb 25. J Biol Chem. 2009. PMID: 19244230 Free PMC article.
-
Epac-selective cAMP analogs: new tools with which to evaluate the signal transduction properties of cAMP-regulated guanine nucleotide exchange factors.Cell Signal. 2008 Jan;20(1):10-20. doi: 10.1016/j.cellsig.2007.07.009. Epub 2007 Jul 25. Cell Signal. 2008. PMID: 17716863 Free PMC article. Review.
-
Cell physiology of cAMP sensor Epac.J Physiol. 2006 Nov 15;577(Pt 1):5-15. doi: 10.1113/jphysiol.2006.119644. Epub 2006 Sep 14. J Physiol. 2006. PMID: 16973695 Free PMC article. Review.
Cited by
-
Exendin-4 affects calcium signalling predominantly during activation and activity of beta cell networks in acute mouse pancreas tissue slices.Front Endocrinol (Lausanne). 2024 Jan 16;14:1315520. doi: 10.3389/fendo.2023.1315520. eCollection 2023. Front Endocrinol (Lausanne). 2024. PMID: 38292770 Free PMC article.
-
Pleiotropic Effects of GLP-1 and Analogs on Cell Signaling, Metabolism, and Function.Front Endocrinol (Lausanne). 2018 Nov 23;9:672. doi: 10.3389/fendo.2018.00672. eCollection 2018. Front Endocrinol (Lausanne). 2018. PMID: 30532733 Free PMC article. Review.
-
The regulatory effects of second-generation antipsychotics on lipid metabolism: Potential mechanisms mediated by the gut microbiota and therapeutic implications.Front Pharmacol. 2023 Jan 25;14:1097284. doi: 10.3389/fphar.2023.1097284. eCollection 2023. Front Pharmacol. 2023. PMID: 36762113 Free PMC article. Review.
-
Glucagon-like peptide 1 stimulates post-translational activation of glucokinase in pancreatic beta cells.J Biol Chem. 2011 May 13;286(19):16768-74. doi: 10.1074/jbc.M110.192799. Epub 2011 Mar 25. J Biol Chem. 2011. PMID: 21454584 Free PMC article.
-
New insights concerning the molecular basis for defective glucoregulation in soluble adenylyl cyclase knockout mice.Biochim Biophys Acta. 2014 Dec;1842(12 Pt B):2593-600. doi: 10.1016/j.bbadis.2014.06.023. Epub 2014 Jun 27. Biochim Biophys Acta. 2014. PMID: 24980705 Free PMC article. Review.
References
-
- Asfari M, Janjic D, Meda P, Li G, Halban PA, Wollheim CB. Establishment of 2-mercaptoethanol-dependent differentiated insulin-secreting cell lines. Endocrinology. 1992;130:167–178. - PubMed
-
- Barnett DW, Pressel DM, Chern HT, Scharp DW, Misler S. cAMP-enhancing agents ‘permit’ stimulus-secretion coupling in canine pancreatic islet β-cells. J Membr Biol. 1994;138:113–120. - PubMed
-
- Baukrowitz T, Schulte U, Oliver D, Herlitze S, Krauter T, Tucker SJ, Ruppersberg JP, Fakler B. PIP2 and PIP as determinants for ATP inhibition of KATP channels. Science. 1998;282:1141–1144. - PubMed
Publication types
MeSH terms
Substances
Grants and funding
LinkOut - more resources
Full Text Sources
Molecular Biology Databases
Miscellaneous