. 2008 Apr;22(4):989-1005.
doi: 10.1210/me.2007-0473. Epub 2008 Jan 17.

Carboxypeptidase E cytoplasmic tail-driven vesicle transport is key for activity-dependent secretion of peptide hormones

Affiliations

Carboxypeptidase E cytoplasmic tail-driven vesicle transport is key for activity-dependent secretion of peptide hormones

Joshua J Park et al. Mol Endocrinol. 2008 Apr.

Abstract

Vesicular transport of peptide hormones from the cell body to the plasma membrane for activity-dependent secretion is important for endocrine function, but how it is achieved is unclear. Here we uncover a mechanism in which the cytoplasmic tail of transmembrane carboxypeptidase E (CPE) found in proopiomelanocotin (POMC)/ACTH vesicles interacts with microtubule-based motors to control transport of these vesicles to the release site in pituitary cells. Overexpression of the CPE tail in live cells significantly reduced the velocity and distance of POMC/ACTH- and CPE-containing vesicle movement into the cell processes. Biochemical studies showed that the CPE tail interacted with dynactin, which, in turn, recruited microtubule plus-end motors kinesin 2 and kinesin 3. Overexpression of the CPE tail inhibited the stimulated secretion of ACTH from AtT20 cells. Thus, the CPE cytoplasmic tail interaction with dynactin-kinesin 2/kinesin 3 plays an important role in the transport of POMC vesicles for activity-dependent secretion.


Figures
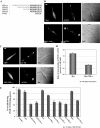
Figure 1
Figure 1
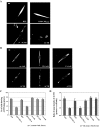
Overexpression of the CPE Cytoplasmic Tail Disrupts POMC/ACTH Vesicle Localization in AtT20 Cell Processes A, Amino acid sequences of the different C-terminal constructs of CPE used for in vitro and in vivo studies. Amino acids in the cytoplasmic tail are shown in bold. B, Immunocytochemistry showing the intracellular distribution of POMC/ACTH in AtT20 cells expressing Myc (top panels) or Myc-CPEC10 (bottom panels). POMC/ACTH and the Myc tag were detected as described in Materials and Methods. Differential interference contrast (DIC) images for Myc/Myc-CPEC10-expressing cells showed no major difference in cell morphology (DIC). Scale bar, 5 μm. C, Immunocytochemistry showing the intracellular distribution of POMC/ACTH in AtT20 cells expressing GFP (top panels) or GFP-CPEC10 (bottom panels). Differential interference contrast (DIC) images for GFP/GFP-CPEC10-expressing cells showed no major difference in cell morphology (DIC). Scale bar, 5 μm. D, Bar graph showing the ratio of the mean immunostaining intensity of POMC/ACTH in the processes relative to the cell body, in cells overexpressing GFP-CPEC10 or GFP alone. The intensity of POMC/ACTH immunostaining in the processes and cell body of 50 AtT20 cells in each case was quantified using Metamorph software. E, Bar graph showing the quantification of the number of cells with accumulation of punctate POMC/ACTH immunostaining in the processes in untransfected cells (untransf.) and cells transfected with GFP alone, Myc alone, RFP alone, GFP-CPEC10, GFP-CPEC25, Myc-CPEC6, Myc-CPEC10, Myc-CPEC15, Myc-CPEC20, or RFP-CPEC10. A total of 100 cells expressing each of the constructs was scored in three independent experiments.
Figure 2
Figure 2
Overexpression of Different Arf6 Forms Do Not Affect ACTH Vesicle Transport into the Processes of AtT20 Cells A, Immunocytochemistry showing the intracellular distribution of ACTH in AtT20 cells expressing RFP (top panels) or RFP-CPEC10 (bottom panels). Scale bar, 5 μm. B, Immunocytochemistry showing the intracellular distribution of ACTH in AtT20 cells expressing HA-tagged wt/DN/CA-Arf6. ACTH and HA-tagged Arf6s were detected as described in Materials and Methods. Scale bar, 5 μm. C, Bar graph showing the quantification of the number of cells with accumulation of punctate ACTH immunostaining in the processes in untransfected cells (untransf.) and cells transfected with wt-Arf6, DN-Arf6, CA-Arf6, GFP, or GFP-CPEC10. A total of 100 cells expressing each of the constructs was scored in three independent experiments. D, Bar graph showing the ratio of the mean immunostaining intensity of ACTH in the processes relative to the cell body in untransfected cells (untransf.) or cells overexpressing wt/DN/CA-Arf6, GFP/GFP-CPEC10, or RFP/RFP-CPEC10 (n = 40). The intensity of ACTH immunostaining in the processes and cell body of AtT20 cells in each condition was quantified using Metamorph software.
Figure 3
Figure 3
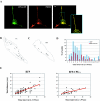
Overexpression of RFP-CPEC10 Disrupts Transport of Secretory Vesicles Containing Fluorescence-Tagged CPE and POMC in Live AtT20 Cells A, Images of AtT20 cells expressing CPE-GFP (green) and immunostained with anti-POMC/ACTH (red). Note the colocalization of CPE-GFP and POMC/ACTH in vesicles (yellow punctate staining in merged images: colocalization correlation r = 0.76 ± 0.01) in the cell processes (see high-magnification inset). Scale bar, 5 μm. B, Tracks of each CPE-GFP vesicle movement in cells expressing RFP alone (supplemental Fig. 3 video). Scale bar, 5 μm. C, Tracks of each CPE-GFP vesicle movement in cells expressing RFP-CPEC10 (supplemental Fig. 3 video 2). Scale bar, 5 μm. D, Bar graph showing the number of vesicles that moved and the duration of their movement. Note the reduction in the total number of vesicles that moved and the reduced duration of the vesicles that did move in the RFP-CPEC10-expressing AtT20 cells compared with RFP alone. E, Graphs showing analyses of live cell images of in vivo movement of CPE-GFP secretory vesicles in AtT20 cells (RFP, 81 vesicles, four cells; RFP-CPEC10, 33 vesicles, six cells) (B, supplemental Fig. 3 videos 1 and 2). Each image was taken at a time interval of 1.97 sec and the total distance calculated. Both the overall velocity and duration of vesicle movement were decreased by overexpression of RFP-CPEC10.
Figure 4
Figure 4
Overexpression of GFP-CPEC25 Disrupts Transport of Secretory Vesicles Containing Fluorescence-Tagged CPE and POMC in Live Anterior Pituitary Cells A, Tracks of each CPE-RFP vesicle movement in cells expressing GFP alone (supplemental Fig. 4 video 1). Scale bar, 5 μm. B, Tracks of each CPE-RFP vesicle movement in cells expressing GFP-CPEC25 (supplemental Fig. 4 video 2). Scale bar, 5 μm. C, Bar graph showing the number of vesicles that moved and the duration of their movement. Note the reduction in the total number of vesicles that moved and the reduced duration of the vesicles that did move in the GFP-CPEC25-expressing cells compared with GFP alone. D, Graphs showing analyses of live cell images of in vivo movement of CPE-RFP secretory vesicles in primary cultures of anterior pituitary cells transfected with GFP-CPEC25, which has a similar competitive behavior as CPEC10 (see Fig. 1D). The number of cells analyzed was 43 vesicles in two cells for GFP and 28 vesicles in 5 cells for GFP-CPEC25 (supplemental Fig. 4 videos 1 and 2). Each image was taken at a time interval of 0.984 sec and the total distance calculated. Both the overall velocity and duration of vesicle movement were decreased by overexpression of GFP-CPEC25.
Figure 5
Figure 5
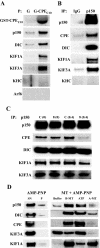
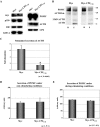
The Cytoplasmic Tail of CPE Interacts with Endogenous Dynactin, KIF3A, KIF1A, and Dynein from AtT20 Cell Cytosol A, Immunoblots showing proteins pulled down by GST-tagged CPEC10 or GST alone from AtT20 cell cytosol. G, GST alone; P, precipitation. B, Immunoblot showing proteins coimmunoprecipitated with dynactin (p150). Anti-p150 antibody or rabbit IgG was added to cytosol from AtT20 cells for coimmunoprecipitation. IP, Immunoprecipitation; p150, anti-p150 antibody. C, Immunoblot showing proteins coimmunoprecipitated with anti-p150 in the presence of CPEC8 peptide (8) or control peptide (C) added to the cytosol of AtT20 cells; 0 or 0.4 μg/ml of each peptide was used. D, Immunoblot of proteins bound to microtubules and released by ATP. Microtubule co-pelleting assays were performed to examine the microtubule-binding nature of CPE, motor proteins, and their associated proteins in AtT20 cell cytosol. Buffer indicates wash with buffer alone, and ATP indicates wash with buffer containing ATP. A-MT, Microtubule pellet washed with ATP buffer; B-MT, microtubule pellet washed with buffer; P, pellet; SN, supernatant.
Figure 6
Figure 6
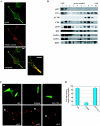
Microtubule Motors Are Associated with ACTH Vesicles, and Overexpression of GFP-CPEC10 Does Not Affect Dynactin Integrity A, Immunocytochemistry showing the distribution of endogenous dynactin and POMC/ACTH in AtT20 cells. Dynactin (green) and POMC/ACTH (red) were detected as described in Materials and Methods. The composite images (bottom panel and inset, colocalization correlation r = 0.83 ± 0.019), showing yellow punctate staining in the processes and tips, indicate overlap and association of cytosolic dynactin with POMC/ACTH vesicles. Scale bar, 5 μm. B, Immunoblot of proteins in light/floating and heavy membrane fractions. Subcellular fractionation of AtT20 cells was carried out by performing 0.6–1.8 m sucrose equilibrium centrifugation, and 1.5% of each fraction was analyzed on the gel. C, Morphology of the Golgi complex in AtT20 cells expressing GFP, GFP-p50, or GFP-CPEC10. Arrows indicate the Golgi complex in cells expressing GFP proteins. D, Bar graph showing the quantification of the number of cells with either compact or dispersed Golgi complex in different conditions. A total of 100 cells expressing each of the constructs was scored in three independent experiments.
Figure 7
Figure 7
Overexpression of Myc-CPEC10 Diminishes Regulated Secretion of ACTH from AtT20 Cells A, Western blot of AtT20 cell lysate from cells expressing Myc- or Myc-CPEC10. Equal amounts of protein (50 μg) from either Myc-transfected (Myc) or Myc-CPEC10-transfected AtT20 cells were separated on NuPAGE gels and proteins detected by immunoblotting. B, Western blot analysis of POMC/ACTH proteins secreted from Myc- and Myc-CPEC10-transfected AtT20 cells in response to stimulation. A 30-min basal medium (B) and a 30-min stimulated medium (S; 2 mm BaCl2 plus 50 mm KCl) were analyzed. Secreted POMC-related proteins were detected by immunoblotting. Myc-CPEC10 expression significantly diminished stimulated secretion of 13-kDa ACTH and ACTH but not POMC or a POMC-derived ACTH intermediate (Int). C, Bar graph showing fold stimulation of ACTH and 13-kDa ACTH secretion from Myc- and Myc-CPEC10 transfected AtT20 cells. Fold stimulation was calculated from four independent secretion assays (mean ± sem). D and E, Bar graphs showing constitutive secretion of POMC (in arbitrary units) from Myc- and Myc-CPEC10-transfected AtT20 cells without (lanes B above) and during (lanes S above) stimulation. The data shown are from three independent secretion assays (mean ± sem).
Figure 8
Figure 8
Model Showing the Mechanism for Transport of POMC/ACTH Vesicles The cytoplasmic tail of transmembrane CPE in these POMC vesicles recruits dynactin that associates with and confers processivity to KIF1A (kinesin 3) and KIF3A (kinesin 2). KIF1A and KIF3A, plus-end microtubule-based motors, simultaneously bind dynactin and microtubules to mediate delivery of these vesicles to the release site for activity-dependent secretion of ACTH from endocrine cells. Dynein, a minus-end-directed motor, also binds dynactin and mediates return of secretory vesicles from the process terminal back to the cell body under nonstimulated conditions in neurons (see text).

Similar articles

Cited by

References

    1. Alexander K, Nikodemova M, Kucerova J, Strbak V 2005 Colchicine treatment differently affects releasable thyrotropin-releasing hormone (TRH) pools in the hypothalamic paraventricular nucleus (PVN) and the median eminence (ME). Cell Mol Neurobiol 25:681–695 - PMC - PubMed
    1. Rudolf R, Salm T, Rustom A, Gerdes HH 2001 Dynamics of immature secretory granules: role of cytoskeletal elements during transport, cortical restriction, and F-actin-dependent tethering. Mol Biol Cell 12:1353–1365 - PMC - PubMed
    1. Hamm-Alvarez SF, Da Costa S, Yang T, Wei X, Gierow JP, Mircheff AK 1997 Cholinergic stimulation of lacrimal acinar cells promotes redistribution of membrane-associated kinesin and the secretory protein, β-hexosaminidase, and increases kinesin motor activity. Exp Eye Res 64:141–156 - PubMed
    1. Senda T, Yu W 1999 Kinesin cross-bridges between neurosecretory granules and microtubules in the mouse neurohypophysis. Neurosci Lett 262:69–71 - PubMed
    1. Pack-Chung E, Kurshan PT, Dickman DK, Schwarz TL 2007 A Drosophila kinesin required for synaptic bouton formation and synaptic vesicle transport. Nat Neurosci 10:980–989 - PubMed

Publication types

MeSH terms