. 2008 May;22(5):1125-40.
doi: 10.1210/me.2007-0445. Epub 2008 Jan 17.

Cooperative control via lymphoid enhancer factor 1/T cell factor 3 and estrogen receptor-alpha for uterine gene regulation by estrogen

Affiliations

Cooperative control via lymphoid enhancer factor 1/T cell factor 3 and estrogen receptor-alpha for uterine gene regulation by estrogen

Sanhita Ray et al. Mol Endocrinol. 2008 May.

Abstract

Accumulating evidence indicates that estrogen regulates diverse but interdependent signaling pathways via estrogen receptor (ER)-dependent and -independent mechanisms. However, molecular relationship between these pathways for gene regulation under the direction of estrogen remains unknown. To address this possibility, our uterine analysis of Wnt/beta-catenin downstream effectors revealed that lymphoid enhancer factor 1 (Lef-1) and T cell factor 3 (Tcf-3) are up-regulated temporally by 17beta-estradiol (E2) in an ER-independent manner. Lef-1 is abundantly up-regulated early (within 2 h), whereas Tcf-3 is predominantly induced after 6 h, and both are sustained through 24 h. Interestingly, activated Lef-1/Tcf-3 molecularly interacted with ERalpha in a time-dependent manner, suggesting they possess a cross talk in the uterus by E2. Moreover, dual immunofluorescence studies confirm their colocalization in uterine epithelial cells after E2. Most importantly, using chromatin immunoprecipitation followed by PCR analyses, we provide evidence for an interesting possibility that ERalpha and Tcf-3/Lef-1 complex occupies at certain DNA regions of estrogen-responsive endogenous gene promoters in the mouse uterus. By selective perturbation of activated Lef-1/Tcf-3 or ERalpha signaling events, we provide in this study novel evidence that cooperative interactions, by these two different classes of transcription factors at the level of chromatin, direct uterine regulation of estrogen-responsive genes. Collectively, these studies support a mechanism that integration of a nonclassically induced beta-catenin/Lef-1/Tcf-3 signaling with ERalpha is necessary for estrogen-dependent endogenous gene regulation in uterine biology.


Figures
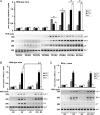
Figure 1
Figure 1
E2 Regulates Uterine Expression of Lef-1 and Tcf-3 mRNAs in Wild-Type and ERα(−/−) Mice, and This Expression Is Unresponsive to ICI A, Temporal effects of E2 in wild-type mice. Adult ovariectomized wild-type mice were given a single injection of E2 (100 ng/mouse) or oil (as vehicle control) and killed at indicated times. In this representative figure, independent preparations of total RNAs from three different mice were analyzed by comparative RT-PCR at indicated PCR cycle numbers to achieve linear amplification for genes of interest. Amplified DNA bands were visualized by ethidium bromide staining. B, Effects of ICI on E2-dependent regulation in wild-type mice. Adult ovariectomized wild-type mice were given an injection of oil, E2 (100 ng/mouse), ICI (500 μg/mouse), or ICI 30 min before an injection of E2 and killed 12 h after the last injection. Comparative RT-PCR analyses using three independent total RNA samples were as described in panel A. C, Effects of ICI on E2-dependent regulation in ERα(−/−) mice. Adult ovariectomized ERα(−/−) mice were given an injection of oil, E2 (100 ng/mouse), ICI (500 μg/mouse), or ICI 30 min before an injection of E2 and killed 12 h after the last injection. Comparative RT-PCR analyses using three independent total RNA samples were followed as described in Fig. 1A. All experiments in panels A–C were repeated at least three times. In the bar plots, the abundance of mRNAs for each gene expression was quantitated by analysis of band intensities using densitometric scanning and was corrected against rpL7. *, Values are statistically different (P < 0.05, Student's t test) from the corresponding control groups. **, Statistically different between the compared groups (P < 0.05, Student's t test).
Figure 2
Figure 2
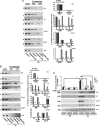
Temporal Analysis of E2-Dependent Regulation of Lef-1, Tcf-3, Activated/Total β-Catenin, and ERα Proteins in Uterine Tissue Extracts of Wild-Type Mice Adult ovariectomized mice were given a single injection of E2 (100 ng/mouse) and killed at indicated times. Mice injected with oil were killed after 24 h and served as control. Whole uterine tissue extracts were analyzed by Western blotting using primary antibodies against Lef-1, Tcf-3, β-catenin (active), β-catenin, ERα, and actin. Relative changes in protein levels were measured by densitometric analysis of band intensities followed by correction with that of β-actin. Values with range of responses from two different set of experiments are shown as dots in the bar plots.
Figure 3
Figure 3
Analysis of E2-Dependent Protein-Protein Interaction between Wnt/β-Catenin-Activated Tcf-3/Lef-1 and ERα in the Mouse Uterus Adult ovariectomized wild-type mice were given a single injection of E2 (100 ng/mouse) and killed at indicated times. Mice injected with oil were killed after 24 h and served as control. Whole uterine tissue extracts were immunoprecipitated with β-catenin (A)- or ERα (B)-specific antibodies followed by Western blotting for Lef-1, Tcf-3, β-catenin, and ERα. Arrows denote position of detected protein bands. The intense band detected at approximately 55 kDa in all panels represents heavy chain subunit of IgG (this is shown as internal loading control). In control experiments, imunoprecipitation using normal serum did not detect any specific bands by Western blotting (data not shown). These experiments were repeated at least three times with similar results. IP, Immunoprecipitation; WB, Western blot.
Figure 4
Figure 4
Dual Immunofluorescence Staining for Lef-1 (A–F) or Tcf-3 (G–L) in Conjunction with ERα in the Uterus by Oil (A–C and G–I) or E2 (D–F and J–L) Ovariectomized wild-type mice were treated with oil or E2 (100 ng/mouse) and killed after 24 h. Formalin-fixed paraffin-embedded uterine sections (6 μm) were incubated with primary antibodies for ERα and Tcf-3/Lef-1 followed by incubation of secondary antibodies tagged with Texas red (red) and FITC (green), respectively. Superimposed (merge) images showing yellow-colored cells represent expression of both. No immunostaining was noted when sections were incubated with preimmune serum instead of primary antibody (data not shown). Pictures (A–L) were taken at ×20, and the insets were at ×40. le, Luminal epithelium; ge, glandular epithelium. These experiments were repeated three times with three to four mice in each group, and similar results were obtained.
Figure 5
Figure 5
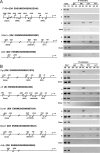
Analysis of Estrogen-Dependent Recruitments of ERα and Lef-1/Tcf-3 at Specific Sites of c-Myc, Cdkn1a, Pgr, Ltf, Ccnd1, and Mmp-7 Gene Promoters Analysis of recruitments for ERα and Lef-1/Tcf-3 on endogenous uterine gene promoters for c-Myc and Cdkn1a at 2 h (A), and for Pgr, Ltf, Ccnd1, and Mmp7 at 24 h (B) after E2 or oil treatments. Adult ovariectomized wild-type mice were given a single injection of E2 (100 ng/mouse) or oil (as vehicle control) and killed at indicated times. ChIP analyses were performed using ERα, lef-1, or Tcf-3 antibodies, or normal serum IgG (as control), followed by PCR. The specific regions as depicted in this figure were analyzed by a set of primers as described in Materials and Methods. The presence of the promoter-specific DNA before immunoprecipitation was confirmed by PCR (input). The details for PCR amplification and the number of cycles parameter were the same as described in Materials and Methods. Analysis of Actb gene promoter was used in parallel (as a control) to compare the status of transcription factors recruitment on an estrogen-insensitive gene promoter. The amplified product sizes (bp) were for c-Myc: 170 (A), 199 (B), 162 (C), and 159 (distal); Cdkn1a: 192 (A), 186 (B), and 180 (distal); Pgr: 191 (A), 151(B), and 222 (distal); Ltf: 199 (A), 151 (B), 150 (C), and 249 (distal); Ccnd1: 179 (A), 199 (B), and 300 (distal); Mmp7: 185 (A), 167 (B), and 167 (distal); Actb: 234. ID#, Identification number; IP, immunoprecipitation.
Figure 6
Figure 6
Selected Perturbation of Wnt/β-Catenin or ERα Signaling Axis Determines a correlation for DNA-Specific Recruitments of Lef-1/Tcf-3 and/or ERα with the Alteration of Estrogenic Early Gene Expression in the Mouse Uterus A, Analysis of recruitment of ERα and Lef-1 on c-Myc, Cdkn1A, and Actb promoters. ChIP analysis was performed using ERα and lef-1-specific antibodies in the uteri of mice, after administration of rAdSFRP2(S) or rAdGFP (as control), followed by E2 (100 ng/mouse) for 2 h. B, Analysis of recruitment of ERα and Lef-1 on c-Myc, Cdkn1A, and Actb promoters. ChIP analysis was performed using ERα and lef-1-specific antibodies in the uteri of mice, after administration of rAdBip(As) or rAdGFP (as control), followed by E2 (100 ng/mouse) for 2 h. Representative figures for recruitments of individual transcription factors on different gene promoters are shown (A and B). The amplified product sizes for different regions of the promoters were the same as described in Fig. 5. Three independent analyses were performed to compare the results, as shown in the bar plot (A and B). The quantitation of relative levels for binding of transcription factors on different gene promoters is represented as percent of input. *, Values are statistically different (P < 0.05, Student's t test) from the corresponding control groups. C, RT-PCR analysis of c-Myc and Cdkn1A gene expression after adenovirus administration. Uterine tissues were collected after rAdBipAs, rAdSFRP-2(s), or rAdGFP (as control) administration, followed by oil or E2 (100 ng/mouse) for 2 h. Ribosomal protein L-7 (rpl-7) was used as a constitutive gene control. Comparative RT-PCR analyses using three independent total RNA samples were followed as described in Fig. 1A. These experiments were repeated at least three times. In the bar plots, the abundance of mRNAs for each gene expression was quantitated by analysis of band intensities using densitometric scanning and was corrected against rpL7. *, Values are statistically different (P < 0.05, Student's t test) from the corresponding control groups. IP, Immunoprecipitation.
Figure 7
Figure 7
Selected Perturbation of Wnt/β-Catenin or ERα Signaling Axis Determines a Correlation for DNA-Specific Recruitments of Lef-1/Tcf-3 and/or ERα with the Alteration of Estrogenic Late Gene Expression in the Mouse Uterus A, Analysis of recruitment of ERα and Lef-1 on Pgr, Ltf, Ccnd1, Mmp7, and Actb promoters. ChIP analysis was performed using ERα and lef-1-specific antibodies in the uteri of mice, after administration of rAdSFRP2(S) or rAdGFP (as control), followed by E2 (100 ng/mouse) for 24 h. B, Analysis of recruitment of ERα and Lef-1 on c-Myc, Cdkn1A, and Actb promoters. ChIP analysis was performed using ERα and lef-1-specific antibodies in the uteri of mice, after administration of rAdBip(As) or rAdGFP (as control), followed by E2 (100 ng/mouse) for 24 h. Representative figures for recruitments of individual transcription factors on different gene promoters are shown (A and B). The amplified product sizes for different regions of the promoters were the same as described in Fig. 5. Three independent analyses were performed to compare the results, as shown in bar plot (A and B). The quantitation of relative levels for binding of transcription factors on different gene promoters is represented as percent of input. *, Values are statistically different (P < 0.05, Student's t test) from the corresponding control groups. C, RT-PCR analysis of c-Myc and Cdkn1A gene expression after adenovirus administration. Uterine tissues were collected after rAdBipAs, rAdSFRP-2(s), or rAdGFP (as control) administration, followed by oil or E2 (100 ng/mouse) for 24 h. Ribosomal protein L-7 (rpl-7) was used as a constitutive gene control. Comparative RT-PCR analyses using three independent total RNA samples were as described in Fig. 1A. These experiments were repeated at least three times. In the bar plots, the abundance of mRNAs for each gene expression was quantitated by analysis of band intensities using densitometric scanning and was corrected against rpL7. *, Values are statistically different (P < 0.05, Student's t test) from the corresponding control groups. IP, Immunoprecipitation.

Similar articles

Cited by

References

    1. Couse JF, Korach KS 1999 Estrogen receptor null mice: what have we learned and where will they lead us? Endocr Rev 20:358–417 - PubMed
    1. Stampfer MJ, Willett WC, Colditz GA, Rosner B, Speizer FE, Hennekens CH 1991 Postmenopausal estrogen therapy and cardiovascular disease. Ten-year follow-up from the nurses' health study. N Engl J Med 325:756–762 - PubMed
    1. McDonnell DP, Norris JD 2002 Connections and regulation of the human estrogen receptor. Science 296:1642–1644 - PubMed
    1. Dey SK, Lim H, Das SK, Reese J, Paria BC, Daikoku T, Wang H 2004 Molecular cues to implantation. Endocr Rev 25:341–373 - PubMed
    1. Tsai MJ, O'Malley BW 1994 Molecular mechanisms of action of steroid/thyroid receptor superfamily members. Annu Rev Biochem 63:451–486 - PubMed

Publication types

MeSH terms