. 1991;1(3):185-96.

CpG methylation of an endogenous retroviral enhancer inhibits transcription factor binding and activity

Affiliations

CpG methylation of an endogenous retroviral enhancer inhibits transcription factor binding and activity

B T Lamb et al. Gene Expr. 1991.

Abstract

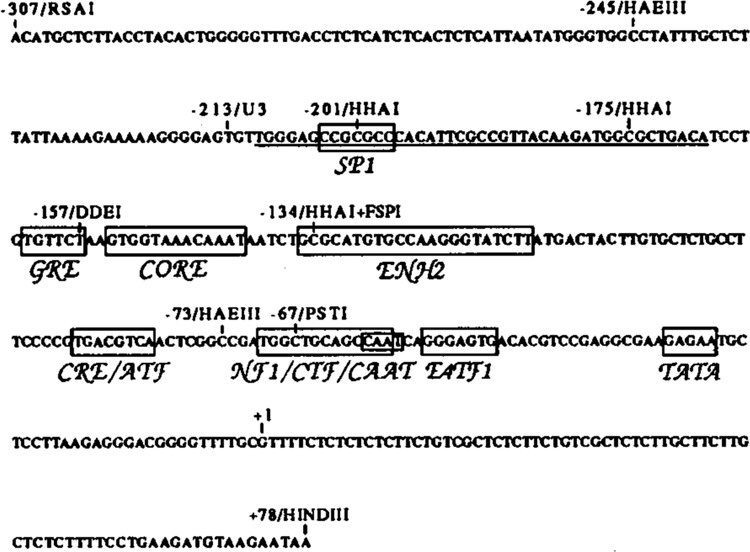
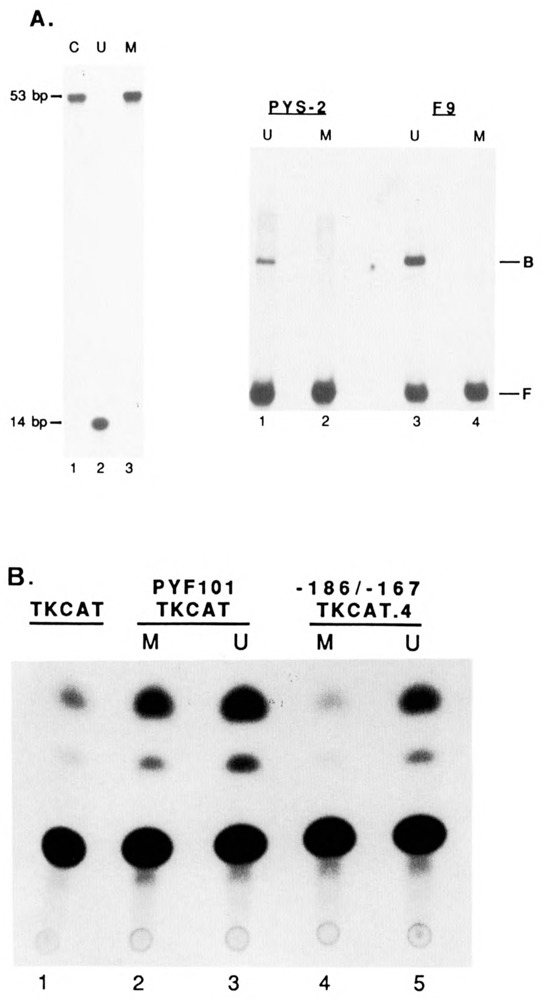
The endogenous retrovirus, intracisternal A-particle (IAP), is expressed at unique stages during murine embryogenesis and is also activated during the in vitro differentiation of F9 cells. We have examined the DNA elements and protein factors that control IAP expression during F9 differentiation. In the present study an IAP upstream enhancer (IUE) is identified by transient transfection assays and found to be active in both undifferentiated and differentiated cells. Further analyses reveal that a ubiquitous 65 kDa protein factor, the IUE binding protein (IUEB), binds with the IUE. Site-specific methylation within the IUEB binding site strongly inhibits both IUEB binding and IUE transcriptional activity, suggesting that methylation may regulate IUE function and IAP expression.


Figures

Figure 1
Figure 1
Nucleotide sequence of the IAP LTR from the pIAP.l sequence (Howe and Overton, 1986). Shown above the sequence are various restriction enzymes sites, the beginning of the LTR (−213), and the transcriptional start site (+1). Boxed with abbreviations below the sequence are transcriptional elements, most of which were identified on the basis of homology to known transcriptional elements, including: an Sp1 binding site (Sp1) (Briggs et al., 1986); a glucocorticoid response element (Scheidereit and Beato, 1984); an SV40 core enhancer sequence (Weiher et al., 1983); a cAMP response element or the homologous ATF binding site (CRE/ATF) (Montminy et al., 1986; Lin and Green, 1988); a nuclear factor 1 or the homologous CCAAT transcription factor binding site (NF1/CTF/CAAT) (Jones et al., 1987); an E4TF1 binding site (E4TF1) (Watanabe et al., 1988); and a non-consensus TATA box. Also boxed is an enhancer element identified on the basis of function that binds protein factor EBP80 (Falzon and Kuff, 1990). The underlined sequence represents the DNAse I footprinted region from −210 to −168 (see Fig. 4).
Figure 2
Figure 2
Transcriptional activity of IAP LTR 5′ deletion mutants. The various 5′ deletion constructs (schematically represented below) were transfected into either PYS-2 (hatched box) or F9 (stippled box) cells. CAT activity is expressed relative to the full-length −307/+78 deletion construct in PYS-2 cells set to 100% activity. The number of independent transfection experiments with each construct is shown in parentheses, with the standard deviation shown as error bars. Transfection of RA/dbcAMP-treated F9 (F9/RA) and HeLa cells gave results similar to PYS-2 cells (+/−10%). Features of the schematic diagram of the IAP LTR are described in Figure 1.
Figure 3
Figure 3
Transcriptional activity of the IAP LTR upstream elements. CAT constructs containing either the IAP −307/−157 fragment (A) or the −213/−167 oligonucleotide covering the footprinted region (B) cloned upstream of the TK promoter in different orientations and copy number (arrows indicate orientation of the elements) were transfected into F9 and PYS-2 cells. CAT activity is expressed relative to the activity of the TK promoter driving CAT expression (pBLCAT2), with each plus sign representing either 2- (A) or 3-fold (B) activation above pBLCAT2 activity. The number of independent transfection experiments with each construct is shown in parentheses. The relative error between independent experiments varied from 2 to 15 %. C. Schematic representation of the IAP upstream elements tested for transcriptional activity with the features of the IAP LTR described in Figure 1.
Figure 4
Figure 4
DNAse I footprint analysis of the IAP LTR upstream region. An IAP fragment from −307 to −67 was end-labeled either on the non-coding strand (A) or coding strand (B), incubated with 0, 6, 17, and 42 μg of nuclear extract from PYS-2 (A, and B, lanes 1–4) and F9 (A and B, lanes 5–8) cells, and digested with DNAse I. Position of the footprint (−210 to −168) is indicated.
Figure 5
Figure 5
A. Band-shift analysis of the IAP upstream −213 to −167 element. Upper panel: 32P-labeled −213/−167 oligonucleotide was incubated with either no extract (lane 1), 6 μg of PYS-2 (lanes 2–11), or 6 μg of F9 (lane 12) nuclear extracts. Competition analysis was performed with a 5-, 20- and 80-fold molar excess of unlabeled −213/−167 (lanes 3–5), IAP-50/+1 (lanes 6–8), and Sp1 oligonucleotide (lanes 9–11). The free (F) and bound (B) forms of the probe are indicated. Lower panel: 32P-labeled oligonucleotide was incubated with either no extract (lane 1), 6 μg of F9 (lanes 2–11), or 6 μg of PYS-2 (lane 12) nuclear extracts, with competition as described in the upper panel. B. UV crosslinking of nuclear proteins to the IAP −213 to −167 element. Nuclear proteins from PYS-2 (lane 1) or F9 (lane 2) cells were UV crosslinked to 32P-labeled bromodeoxyuri-dine-substituted −213/−167 oligonucleotide. Protein molecular weight markers are shown on the left and the size of the major polypeptide species (65 kDa) is indicated.
Figure 6
Figure 6
Methylation interference analysis of the IAP upstream −213 to −167 element with PYS-2 (A) and F9 (B) nuclear extracts. The patterns for both non-coding (lanes 1–3) and coding (lanes 4–6) strands and the piperidine cleavage patterns for the probe not incubated with extract (G, lanes 1 and 4), and the free (F, lanes 2 and 5) and bound (B, lanes 3 and 6) forms of probe are shown. The IAP sequences surrounding the interfered regions, from −180 to −171, are shown with the G residues that diminish binding when methylated (denoted by dashes).
Figure 7
Figure 7
Nucleotide sequence of the IUEB and related binding sites: the IUEB binding site within the IAP LTR; the E1 element of the immunoglobulin heavy chain enhancer (Ephrussi et al., 1985; Weinberger et al., 1986); the Nir box in the insulin enhancer (Moss et al., 1988); the downstream (D) and upstream (U) binding sites in the tyrosine aminotransferase (TAT) regulatory region; and the binding sites for transcription factors BF-H in the polyomavirus enhancer and LBP in the Moloney murine leukemia virus enhancer. Methylation of G residues that intefered with protein binding by in vitro methylation interference or G residues that were protected by protein binding by in vivo methylation protection are indicated by asterisks, while G residues that are enhanced by in vivo methylation protection are indicated by ovals. Asterisks and ovals underneath C residues in the nucleotides sequences correspond to G residues in the complementary strand of DNA. Dashes in sequences represent nucleotides not present in the respective binding sites. The methylation-sensitive HhaI restriction enzyme site within the IUEB binding site is also indicated.
Figure 8
Figure 8
Transcriptional activity of the IAP upstream −186 to −167 element. A. Schematic representation of CAT constructs with the TK promoter alone, or with four copies of the −186/−167 oligonucleotide cloned upstream of the TK promoter (arrows indicate orientation of oligonucleotide). B. CAT assay of constructs 1 and 2 shown in A transfected into either F9 (lanes 1 and 2, respectively) or PYS-2 (lanes 3 and 4, respectively) cells. The number of independent transfection experiments with each construct that yielded similar results is shown in parentheses in A. C. Schematic representation of the IAP −186 to −167 region, with features of the IAP LTR as described in Figure 1. The boxed IUE sequence represents the IUE as described in the text.
Figure 9
Figure 9
A. Left panel: effect of HhaI methylation on IUEB binding. Sequence gel analysis of end-labeled −213/−167 oligonucleotide that was either methylated (M, lane 3) or unmethylated (U, lane 2) by HhaI methylase and cut with HhaI restriction enzyme. As a control (C, lane 1), −213/−167 oligonucleotide was analyzed in parallel. The size of the full-length (53 bp) and HhaI cleaved (14 bp) oligonucleotide is indicated. Right panel: band-shift analysis of unmethylated (U) and methylated (M) end-labeled −213/−167 oligonucleotide with either PYS-2 (lanes 1 and 2, respectively) or F9 (lanes 3 and 4. respectively) nuclear extracts. The free (F) and bound (B) forms of the probe are indicated. B. Effect of HhaI methylation on IUE transcriptional activity. CAT activity of constructs containing either the TK promoter alone (lane 1), the PyFl0l enhancer cloned upstream of the TK promoter methylated (M, lane 2) or unmethylated (U, lane 3) by HhaI methylase, and four copies of the −186/−167 oligonucleotide cloned upstream of the TK promoter methylated (M, lane 4) or unmethylated (U, lane 5) by HhaI methylase, and transfected into PYS-2 cells. Three independent transfection experiments yielded similar results.

References

    1. Adams R. L. P. (1990), Biochem J 265, 309–320. - PMC - PubMed
    1. Ausubel F. M., Brent R., Kingston R. E., Moore D. D., Seidman J. G., Smith J. A., and Struhl K., eds. (1990), in Current Protocols in Molecular Biology, Green Publishing Associates and Wiley Interscience, John Wiley and Sons, New York.
    1. Becker P. B., Ruppert S., and Schutz G. (1987), Cell 51, 435–443. - PubMed
    1. Briggs M. R., Kadonaga J. T., Bell S. P., and Tjian R. (1986), Science 234, 47–52. - PubMed
    1. Burbelo P. D., Horikoshi S., and Yamada Y. (1990), J Biol Chem 265, 4839–4843. - PubMed

Publication types

MeSH terms