

Mechanism of selectivity in aquaporins and aquaglyceroporins
- PMID: 18202181
- PMCID: PMC2234115
- DOI: 10.1073/pnas.0707662104
Mechanism of selectivity in aquaporins and aquaglyceroporins
Abstract
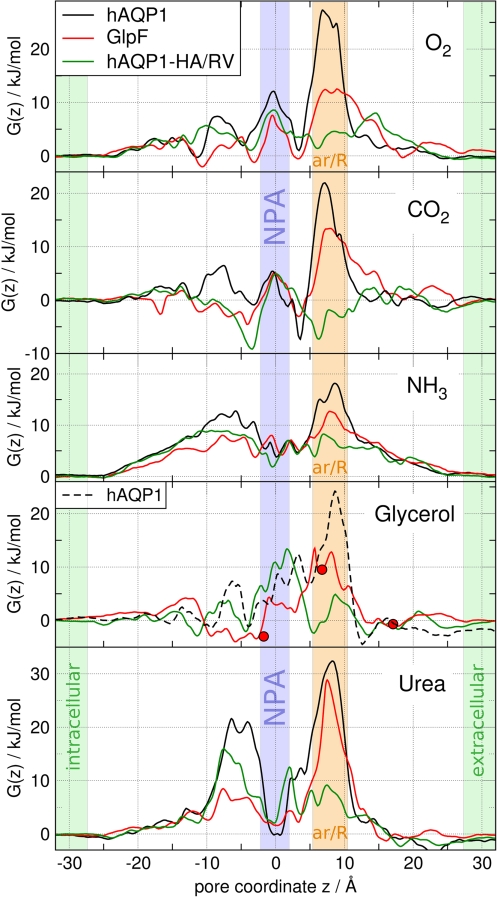
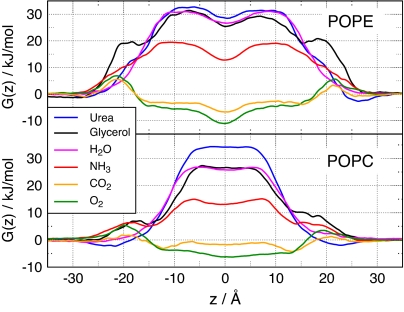
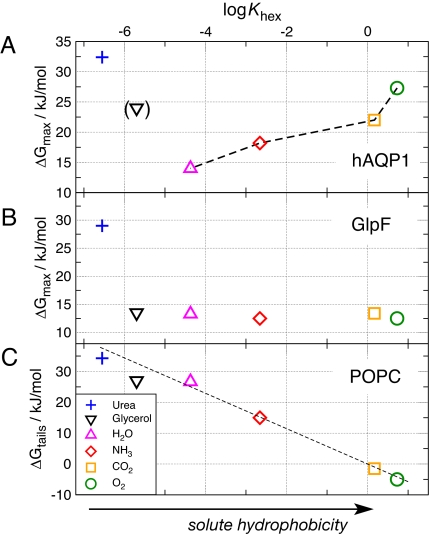
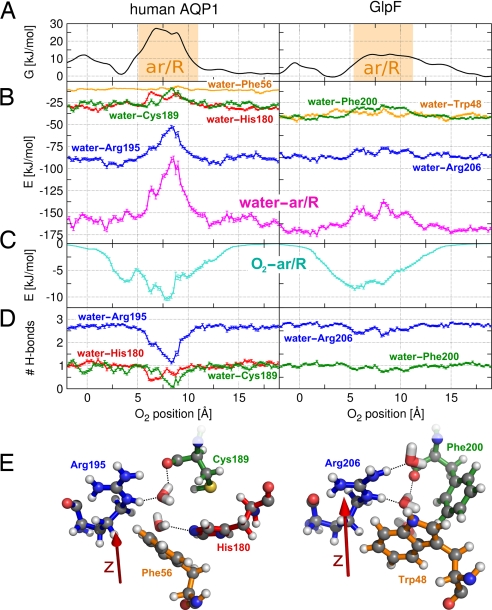
Aquaporins and aquaglyceroporins form a family of pore proteins that facilitate the efficient and selective flux of small solutes across biological membranes. We studied the selectivity of aquaporin-1 (AQP1) and the bacterial glycerol facilitator, GlpF, for O(2), CO(2), NH(3), glycerol, urea, and water. Using molecular dynamics simulations, we calculated potentials of mean force for solute permeation along the aquaporin channels and compared them with the alternative pathway across the lipid bilayer. For small solutes permeating through AQP1, a remarkable anticorrelation between permeability and solute hydrophobicity was observed, whereas the opposite trend was observed for permeation through the membrane. This finding renders AQP1 a selective filter for small polar solutes, whereas GlpF was found to be highly permeable for small solutes and permeable for larger solutes. Surprisingly, not solute-channel but water-channel interactions were found to be the key determinant underlying the selectivity mechanism of aquaporins. Hence, a hydrophobic effect, together with steric restraints, determines the selectivity of aquaporins.
Conflict of interest statement
The authors declare no conflict of interest.
Figures
Similar articles
-
Does CO2 permeate through aquaporin-1?Biophys J. 2006 Aug 1;91(3):842-8. doi: 10.1529/biophysj.106.081406. Epub 2006 May 12. Biophys J. 2006. PMID: 16698771 Free PMC article.
-
Molecular selectivity in aquaporin channels studied by the 3D-RISM theory.J Phys Chem B. 2010 Jun 17;114(23):7967-73. doi: 10.1021/jp101936y. J Phys Chem B. 2010. PMID: 20496877
-
Dynamics and energetics of permeation through aquaporins. What do we learn from molecular dynamics simulations?Handb Exp Pharmacol. 2009;(190):57-76. doi: 10.1007/978-3-540-79885-9_3. Handb Exp Pharmacol. 2009. PMID: 19096772 Review.
-
Water permeation across biological membranes: mechanism and dynamics of aquaporin-1 and GlpF.Science. 2001 Dec 14;294(5550):2353-7. doi: 10.1126/science.1066115. Science. 2001. PMID: 11743202
-
On the definition, nomenclature and classification of water channel proteins (aquaporins and relatives).Mol Aspects Med. 2012 Oct-Dec;33(5-6):514-7. doi: 10.1016/j.mam.2012.04.003. Epub 2012 Apr 19. Mol Aspects Med. 2012. PMID: 22542572 Review.
Cited by
-
Transmembrane Facilitation of Lactate/H+ Instead of Lactic Acid Is Not a Question of Semantics but of Cell Viability.Membranes (Basel). 2020 Sep 15;10(9):236. doi: 10.3390/membranes10090236. Membranes (Basel). 2020. PMID: 32942665 Free PMC article.
-
Aquaporin ion conductance properties defined by membrane environment, protein structure, and cell physiology.Biophys Rev. 2022 Jan 11;14(1):181-198. doi: 10.1007/s12551-021-00925-3. eCollection 2022 Feb. Biophys Rev. 2022. PMID: 35340612 Free PMC article. Review.
-
Cooperativity in Plant Plasma Membrane Intrinsic Proteins (PIPs): Mechanism of Increased Water Transport in Maize PIP1 Channels in Hetero-tetramers.Sci Rep. 2018 Aug 13;8(1):12055. doi: 10.1038/s41598-018-30257-4. Sci Rep. 2018. PMID: 30104609 Free PMC article.
-
Glycerol transport through the aquaglyceroporin GlpF: bridging dynamics and kinetics with atomic simulation.Chem Sci. 2019 Jun 18;10(29):6957-6965. doi: 10.1039/c9sc01690b. eCollection 2019 Aug 7. Chem Sci. 2019. PMID: 31588262 Free PMC article.
-
Aquaporin-driven hydrogen peroxide transport: a case of molecular mimicry?RSC Chem Biol. 2020 Nov 25;1(5):390-394. doi: 10.1039/d0cb00160k. eCollection 2020 Dec 1. RSC Chem Biol. 2020. PMID: 34458769 Free PMC article.
References
-
- Preston GM, Carroll TP, Guggino WB, Agre P. Science. 1992;256:385–387. - PubMed
-
- Zeidel ML, Ambudkar SV, Smith BL, Agre P. Biochemistry. 1992;31:7436–7440. - PubMed
-
- Maurel C, Reizer J, Schroeder JI, Chrispeels MJ, Saier MH. J Biol Chem. 1994;269:11869–11872. - PubMed
-
- Murata K, Mitsuoka K, Walz T, Agre P, Heymann J, Engel A, Fujiyoshi Y. Nature. 2000;407:599–605. - PubMed
-
- Sui H, Han B.-G., Lee JK, Walian P, Jap BK. Nature. 2001;414:872–878. - PubMed
Publication types
MeSH terms
Substances
LinkOut - more resources
Full Text Sources
Molecular Biology Databases
