. 2008 Feb;172(2):321-32.
doi: 10.2353/ajpath.2008.070293. Epub 2008 Jan 17.

Morphological and functional features of hepatic cyst epithelium in autosomal dominant polycystic kidney disease

Affiliations

Morphological and functional features of hepatic cyst epithelium in autosomal dominant polycystic kidney disease

Domenico Alvaro et al. Am J Pathol. 2008 Feb.

Abstract

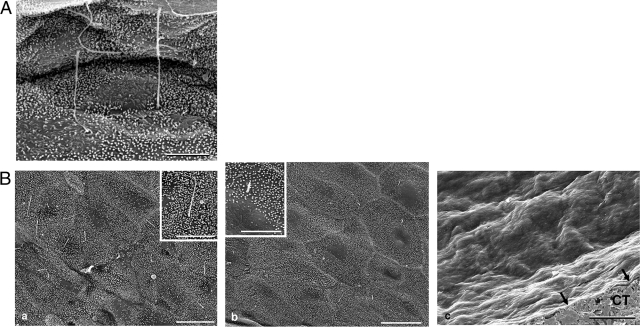
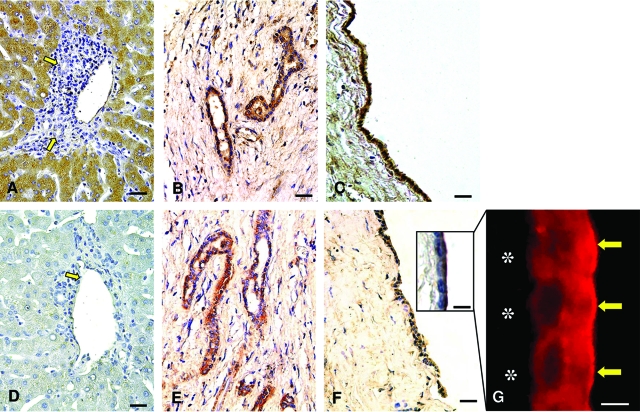
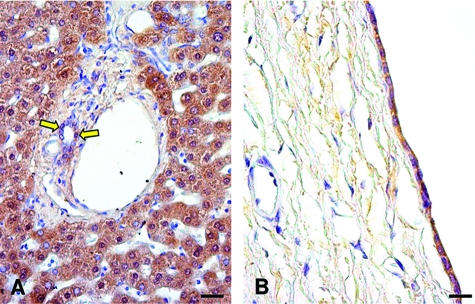
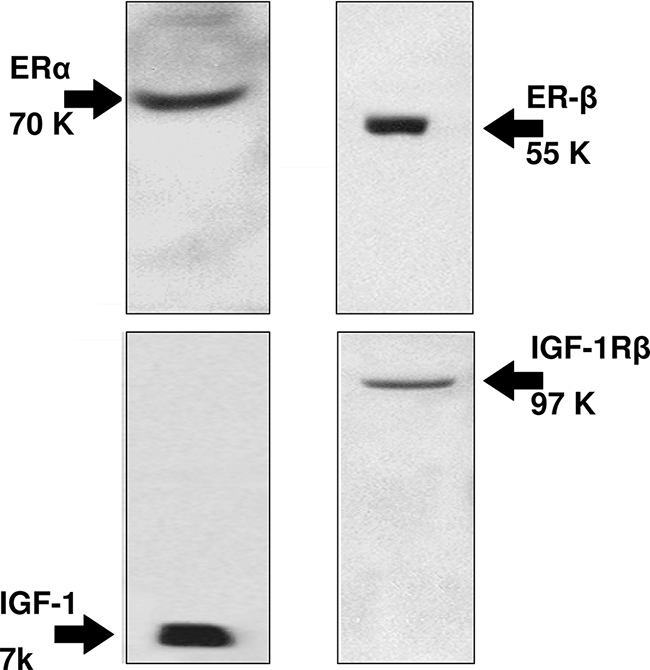
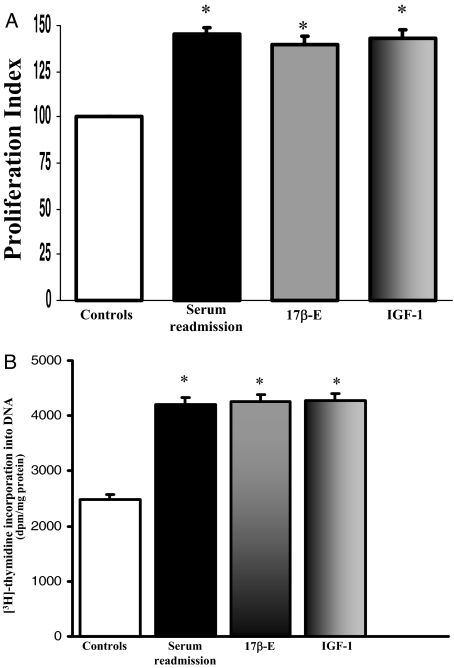
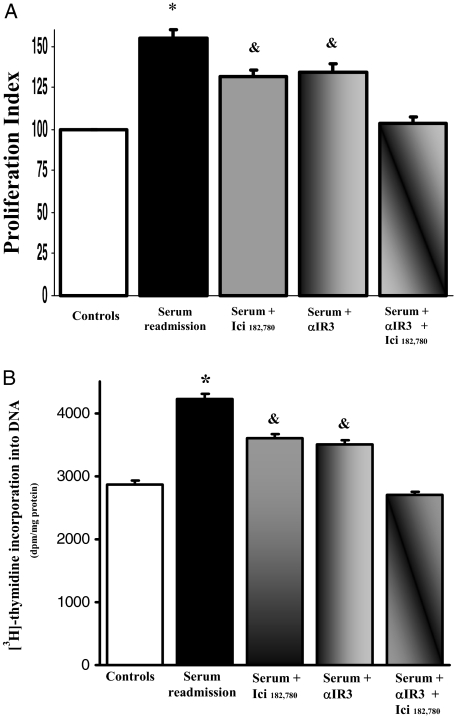
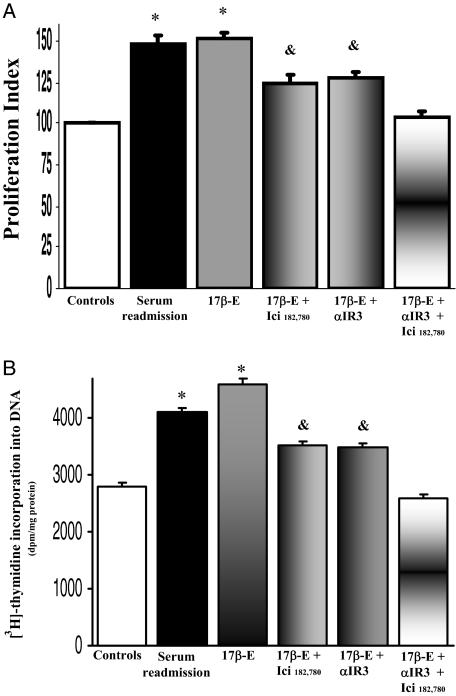
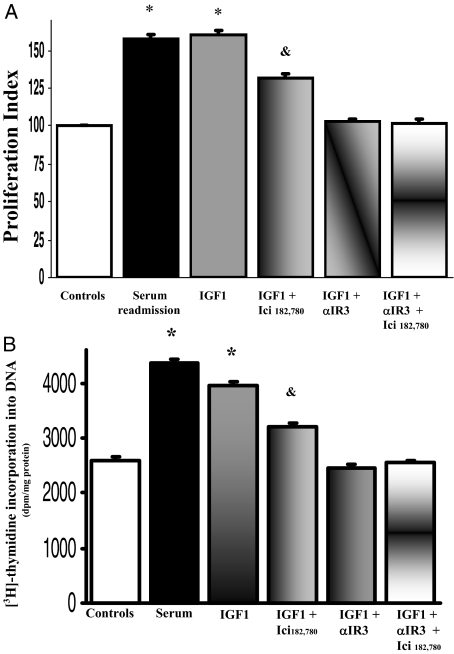
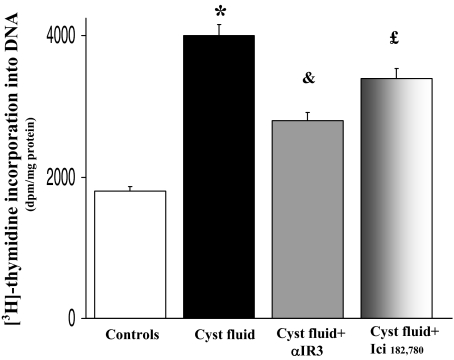
We evaluated the morphological and functional features of hepatic cyst epithelium in adult autosomal dominant polycystic kidney disease (ADPKD). In six ADPKD patients, we investigated the morphology of cyst epithelium apical surface by scanning electron microscopy and the expression of estrogen receptors (ERs), insulin-like growth factor 1 (IGF1), IGF1 receptors (IGF1-R), growth hormone receptor, the proliferation marker proliferating cell nuclear antigen, and pAKT by immunohistochemistry and immunofluorescence. Proliferation of liver cyst-derived epithelial cells was evaluated by both MTS proliferation assay and [(3)H]thymidine incorporation into DNA. The hepatic cyst epithelium displayed heterogeneous features, being normal in small cysts (<1 cm), characterized by rare or shortened cilia in 1- to 3-cm cysts, and exhibiting the absence of both primary cilia and microvilli in large cysts (>3 cm). Cyst epithelium showed marked immunohistochemical expression of ER, growth hormone receptor, IGF1, IGF1-R, proliferating cell nuclear antigen, and pAKT. IGF1 was 10-fold more enriched in the hepatic cyst fluid than in serum. Serum-deprived liver cyst-derived epithelial cells proliferated when exposed to 17beta-estradiol and IGF1 and when exposed to human cyst fluid. ER or IGF1-R antagonists inhibited the proliferative effect of serum readmission, cyst fluid, 17beta-estradiol, and IGF1. Our findings could explain the role of estrogens in accelerating the progression of ADPKD and may suggest a potential benefit of therapeutic strategies based on estrogen antagonism.


Figures

Figure 1
Figure 1
SEM. of luminal surface of normal bile duct (A) and hepatic cystic epithelium of ADPKD liver (B). A: Microvilli and long cilia are present in the luminal surface of normal cholangiocytes. B: a: Similar to the surface of normal cholangiocytes, the epithelium lining small cyst (<1 cm maximum diameter) shows a carpet of regular microvilli and typical primary cilia. Inset: At higher magnification the normal morphology of the cilium is evident. b: the epithelial surface of a cyst with a 2 to 2.5 cm maximum diameter shows less dense microvilli and clear areas become visible. The cilium may be absent or, when present, it is short (2 to 3 μm) and often showed alteration of the apical zone. Inset: At higher magnification a short cilium is evident together with an area clear of microvilli. c: The epithelial surface of a large cyst (>3 cm), appeared completely smooth and extremely thin (black arrows). CT, subepithelial connective tissue. Scale bars: 4 μm (A); B: 8 μm (a, b, inset in a); 20 μm (c), 4 μm (inset in b).
Figure 2
Figure 2
Immunohistochemistry for ER-α and ER-β in normal liver and ADPKD hepatic cysts. In normal (A, E) livers, cholangiocytes lining intrahepatic bile ducts (yellow arrows) are negative for ER-α (A) and ER-β (E). In the ADPKD liver, cholangiocytes lining intrahepatic bile ducts with normal morphology remain negative for ER-α (B, yellow arrow) and ER-β (F, yellow arrow) whereas, cholangiocytes of reactive bile ducts close to the cysts are positive for both ER-α (C) and ER-β (G). The epithelium lining small (C, G) and large cysts (D, H) showed strong positivity for ER-α (C, D) and ER-β (G, H) located at both cytoplasmic and nuclear levels (red arrows). Scale bars: 40 μm (A, B, E–G); 20 μm (C, D, H).
Figure 3
Figure 3
Immunohistochemistry for IGF1 and IGF1-R in normal liver and ADPKD hepatic cysts and immunofluorescence for IGF1-R in hepatic cyst. In normal livers cholangiocytes are negative for IGF1 (A) and IGF1-R (D) (arrows, bile ducts). In ADPKD livers, both IGF1 (B, C) and IGF1-R (E, F) showed positive immunolocalization in the epithelium of small (B, E) and large cysts (C, F). At higher magnification the prevalent apical immunolocalization of IGF1-R is evident, by both immunohistochemistry (F, inset) and immunofluorescence (G, yellow arrows), in the epithelium of a large cyst (asterisk indicates the negativity of subepithelial connective tissue). Scale bars: 40 μm (A–F); 4 μm (G); 6 μm (inset in F).
Figure 4
Figure 4
Immunohistochemistry for GH-R in normal liver and ADPKD hepatic cyst. A: In normal liver, cholangiocytes lining intrahepatic bile ducts (yellow arrows) and hepatocytes were positive for GH-R. B: In the ADPKD liver, the epithelium lining a large cyst showed strong positivity for GH-R. Scale bars: 40 μm (A); 30 μm (B).
Figure 5
Figure 5
Immunohistochemistry for p-AKT and PCNA in normal liver and ADPKD hepatic cyst. In the normal liver cholangiocytes are negative for both p-AKT (A) and PCNA (C) (arrow, bile ducts). In the ADPKD liver, a strong and specific immunoreactivity for pAKT (B) and PCNA (D) of cystic epithelium is evident. At higher magnification (D, inset) the nuclear PCNA positivity is evident. Scale bars = 40 μm.
Figure 6
Figure 6
Protein expression (Western blot) of ER-α, ER-β, IGF1, and IGF1-R in LCDE cell line. LCDE cells express ER-α, ER-β, IGF1, and IGF1-R. Representative of five similar experiments.
Figure 7
Figure 7
Effect of serum, 17β-estradiol, and IGF1 on proliferation of LCDE cell line. A: MTS proliferation assay. LCDE cells cultured in the appropriate medium containing 10% fetal bovine serum were deprived of serum and hormone supplementation (see Materials and Methods) for 24 hours. Then, cells were maintained in serum-deprived conditions for further 12 hours (controls) or exposed to serum, 17β-estradiol (17β-E, 10 nmol/L), IGF1 (10 ng/ml, 1.3 nmol/L) for further 12 hours. Proliferation index was calculated as the ratio (multiplied × 100) between cell number (MTS assay) in stimulated and unstimulated (control) cultures. *P < 0.02 versus controls (analysis of variance). Data were expressed as mean ± SE of n = 8. B: [3H]thymidine incorporation into DNA. [3H]thymidine was added into the culture medium (1 μCi/ml) for the last 2 hours of each treatment. LCDE cells cultured in the appropriate medium containing 10% fetal bovine serum were deprived of serum and hormone supplementation (see Materials and Methods) for 24 hours. Then, cells were maintained in serum-deprived conditions for further 4 hours (controls) or exposed to serum, 17β-estradiol (17β-E), or IGF1 for further 4 hours. Results were expressed as dpm/mg protein. *P < 0.02 versus controls (analysis of variance). Data were expressed as mean ± SE of n = 8.
Figure 8
Figure 8
Effect of ER and IGF1-R antagonists on serum-induced proliferation of serum-deprived LCDE cells. A: MTS proliferation assay. HuH-28 cells cultured in the appropriate medium containing 10% fetal bovine serum were deprived of serum and hormone supplementation (see Materials and Methods) for 24 hours. Then, cells were maintained in serum-deprived conditions for further 12 hours (controls) or exposed to serum ± ER antagonist Ici 182,780 (1 μmol/L) or IGF1-R antagonist αIR3 (1 μg/ml) for 12 hours. Proliferation index was calculated as the ratio (multiplied × 100) between cell number (MTS assay) in stimulated and unstimulated (control) cultures. *P < 0.05 versus other columns; &P < 0.05 versus controls, serum readmission or serum plus Ici 182,780 plus αIR3 (analysis of variance). Data were expressed as mean ± SE of n = 10 independent experiments. B: [3H]thymidine incorporation into DNA. *P < 0.02 versus other columns; &P < 0.02 versus controls, serum readmission or serum plus Ici 182,780 plus αIR3 (analysis of variance). Data were expressed as mean ± SE of n = 8 independent experiments.
Figure 9
Figure 9
Effect of ER and IGF1-R antagonists on 17β-estradiol-induced proliferation of serum-deprived LCDE cells. A: MTS proliferation assay. LCDE cells cultured in the appropriate medium containing 10% fetal bovine serum were deprived of serum and hormone supplementation (see Materials and Methods) for 24 hours. Then, cells were maintained in serum-deprived conditions for further 12 hours (controls) or exposed to serum, 17β-estradiol (17β-E, 10 nmol/L) in the absence or presence of ER antagonist Ici 182,780 (1 μmol/L) or IGF1-R antagonist αIR3 (1 μg/ml) for 12 hours. Proliferation index was calculated as the ratio (multiplied × 100) between cell number (MTS assay) in stimulated and unstimulated (control) cultures. *P < 0.05 versus other columns; &P < 0.05 versus 17β-estradiol alone or 17β-estradiol plus Ici 182,780 plus αIR3 (analysis of variance). Data are mean ± SE of n = 10. B: [3H]thymidine incorporation into DNA. *P < 0.05 versus other columns; &P < 0.05 versus 17β-estradiol alone or 17β-estradiol plus Ici 182,780 plus αIR3 (analysis of variance). Data were expressed as mean ± SE of n = 8.
Figure 10
Figure 10
Effect of ER and IGF1-R antagonists on IGF1-induced proliferation of serum-deprived LCDE cells. A: MTS proliferation assay. LCDE cells cultured in the appropriate medium containing 10% fetal bovine serum were deprived of serum and hormone supplementation (see Materials and Methods) for 24 hours. Then, cells were maintained in serum-deprived conditions for further 12 hours (controls) or exposed to serum, IGF1 (10 ng/ml, 1.3 nmol/L) in the absence or presence of ER antagonist, Ici 182,780 (1 μmol/L), or IGF1-R antagonist αIR3 (1 μg/ml) for 12 hours. Proliferation index was calculated as the ratio (multiplied × 100) between cell number (MTS assay) in stimulated and unstimulated (control) cultures. *P < 0.05 versus other columns; &P < 0.05 versus IGF1 alone or IGF1 plus αIR3 plus Ici 182,780. Data were expressed as mean ± SE of n = 10. B: [3H]thymidine incorporation into DNA. *P < 0.05 versus other columns; &P < 0.05 versus IGF1 alone or IGF1 plus αIR3 plus Ici 182,780 (analysis of variance). Data were expressed as mean ± SE of n = 8.
Figure 11
Figure 11
Effect of cyst fluid on proliferation of LCDE cells. Cyst fluid pooled from five cysts of ADPKD patients was diluted (v/v) with LCDE culture medium to 20% final concentration. Serum-deprived (24 hours) LCDE cells were left without serum for an additional 4 hours (controls) or exposed to cyst fluid ± αIR3 or Ici 182,780 for 4 hours. [3H]Thymidine incorporation into DNA was significantly enhanced by cyst fluid indicating activation of cell proliferation. The effect of cyst fluid was decreased by 55% by the IGF1-R antagonist αIR3 and by 28% by the ER antagonist, Ici 182,780. Data were expressed as mean ± SE of n = 8. *P < 0.02 versus controls; &P < 0.05 versus cyst fluid alone; £P < 0.05 versus cyst fluid alone and versus cyst fluid plus αIR3 (analysis of variance).

Similar articles

Cited by

References

    1. Gabow PA. Autosomal dominant polycystic kidney disease. N Engl J Med. 1993;329:332–342. - PubMed
    1. Ramos A, Torres VE, Holley KE, Offord KP, Rakela J, Ludwig J. The liver in autosomal dominant polycystic kidney disease. Implications for pathogenesis. Arch Pathol Lab Med. 1990;114:180–184. - PubMed
    1. Everson GT. Hepatic cysts in autosomal dominant polycystic kidney disease. Mayo Clin Proc. 1990;65:1020–1025. - PubMed
    1. Arnold HL, Harrison SA. New advances in evaluation and management of patients with polycystic liver disease. Am J Gastroenterol. 2005;100:2569–2582. - PubMed
    1. Everson GT, Emmett M, Brown WR, Redmond P, Thickman D. Functional similarities of hepatic cystic and biliary epithelium: studies of fluid constituents and in vivo secretion in response to secretin. Hepatology. 1990;11:557–565. - PubMed

Publication types

MeSH terms