. 2008 Feb 22;319(5866):1086-9.
doi: 10.1126/science.1152993. Epub 2008 Jan 17.

Differential regulation of dynein and kinesin motor proteins by tau

Affiliations

Differential regulation of dynein and kinesin motor proteins by tau

Ram Dixit et al. Science. .

Abstract

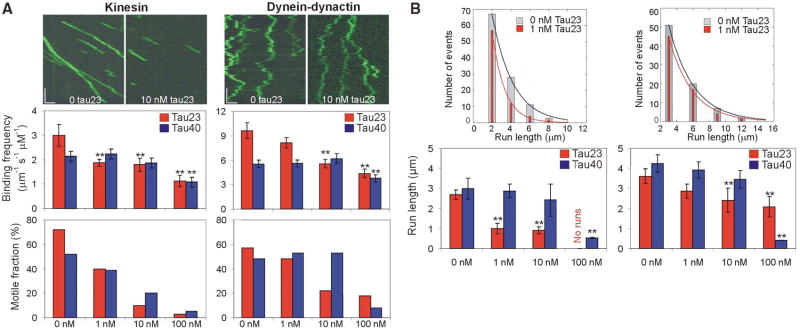
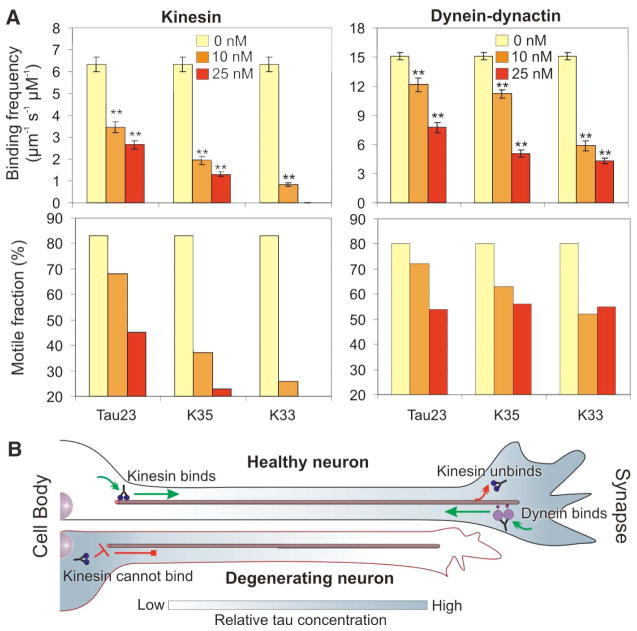
Dynein and kinesin motor proteins transport cellular cargoes toward opposite ends of microtubule tracks. In neurons, microtubules are abundantly decorated with microtubule-associated proteins (MAPs) such as tau. Motor proteins thus encounter MAPs frequently along their path. To determine the effects of tau on dynein and kinesin motility, we conducted single-molecule studies of motor proteins moving along tau-decorated microtubules. Dynein tended to reverse direction, whereas kinesin tended to detach at patches of bound tau. Kinesin was inhibited at about a tenth of the tau concentration that inhibited dynein, and the microtubule-binding domain of tau was sufficient to inhibit motor activity. The differential modulation of dynein and kinesin motility suggests that MAPs can spatially regulate the balance of microtubule-dependent axonal transport.


Figures

Fig. 1
Fig. 1
Decoration of microtubules by Alexa-labeled tau. (A) Tau structure consists of an acidic projection domain and a basic microtubule-binding domain containing microtubule-binding repeats (R1–R4) and proline-rich regions (P1–P3). In the mammalian central nervous system, tau40 is the longest isoform and tau23 is the shortest isoform, which lacks insertions (I1–I2) in the projection domain and the R2 microtubule-binding motif. K35 and K33 are recombinant variants of tau23 that are truncated at their N-termini. Arrowheads indicate the position of cysteine residues used for conjugation of Alexa546. (B) Microtubule labeling by Alexa-tau23 and Alexa-tau40 show a concentration-dependent increase in patch size and fluorescence intensity. (C) Photobleaching of 10 nM Alexa-tau23 patches using 10-fold higher laser intensity than used in 1D and E shows step-wise decreases in fluorescence intensity of the tau patches. Fluorescence intensity along the dotted line is plotted below, indicating four Alexa-tau23 molecules at this position. (D) Binding of 10 nM Alexa-tau23 to a microtubule shows a step-wise increase in fluorescence intensity of the tau patches. Fluorescence intensity along the dotted line is plotted below, showing sequential addition of two Alexa-tau23 molecules. (E) Kymograph shows stable tau decoration during the observation period. x-scale bar = 2 μm; y-scale bar = 10 s.
Fig. 2
Fig. 2
Direct observation of encounters between single molecules of kinesin or dynein-dynactin and Alexa-labeled tau. (A) The effect of Alexa-tau23 (red bars) and Alexa-tau40 (blue bars) on kinesin and dynein motility. Kinesin either detaches, passes or pauses (stationary for ≥10 frames) at a tau patch; whereas, dynein either reverses direction or passes through a tau patch. The number of events is indicated in parentheses. (B and C) The left panel shows an Alexa-tau-decorated microtubule (red), with the relative intensity of tau fluorescence reported as the estimated number of tau molecules on the y-axis. The kymograph (green) shows dissociation of two kinesin molecules (B) or directional reversal of two dynein-dynactin molecules (C) upon encountering a tau cluster (dotted line). The right panel shows select images from each experiment. The arrowheads mark the kinesin or dynein molecules that encountered tau. x-scale bar = 1 μm; y-scale bar = 5 s.
Fig. 3
Fig. 3
Concentration- and isoform-dependent effect of tau on kinesin and dynein-dynactin motility. (A) Representative kymographs show kinesin and dynein-dynactin motility at 0 nM tau23 and at 10 nM tau23. x-scale bar = 1 μm; y-scale bar = 5 s. The bar graphs illustrate the concentration-dependent effect of tau23 (red bars) and tau40 (blue bars) on the average binding frequency and motile fraction of kinesin and dynein-dynactin. The error bars represent the SEM of ≥ 100 events for 0–10 nM tau and the SEM of ~ 50 events for 100 nM tau. A statistically significant difference (p < 0.05) from control is indicated by asterisks. (B) The histograms show the differential effect of 1 nM tau23 (orange bars) on the run length distribution of kinesin and dynein-dynactin. The bar graphs illustrate the concentration-dependent effects of tau23 (red bars) and tau40 (blue bars) on the average run length of kinesin and dynein-dynactin. The error bars represent the SEM of ≥ 100 events for 0–10 nM tau and the SEM of ~30 events for 100 nM tau. A statistically significant difference (p < 0.05) from control is indicated by asterisks.
Fig. 4
Fig. 4
Comparison of the inhibitory effect of full-length and truncated versions of tau23 on kinesin and dynein-dynactin motility. (A) The bar graphs illustrate the effect of 0 nM (yellow bars), 10 nM (orange bars) and 25 nM (red bars) of tau23 and its truncation variants, K35 and K33, on the average binding frequency and percent motile fraction of kinesin and dynein-dynactin. The error bars represent the SEM of ≥ 50 events. A statistically significant difference (p < 0.05) from control is indicated by asterisks. (B) Model of the role of tau in the regulation of axonal transport. In a healthy neuron, tau can be distributed in a proximal-distal gradient (shown in gray) that allows kinesin-driven anterograde transport from the cell body (green arrow). At the synapse, the relatively high tau concentration facilitates kinesin dissociation (red arrow). However, dynein is able to bind to distal microtubules because of its lower sensitivity to tau. In Alzheimer’s disease (degenerating neuron), tau accumulates at the soma and consequently inhibits kinesin-driven anterograde transport (red blocked arrow) leading to neurodegeneration.

References

    1. Chevalier-Larsen E, Holzbaur EL. BioChim BioPhys Acta. 2006;1762:1094. - PubMed
    1. Vale RD. Cell. 2003;112:467. - PubMed
    1. Mallick R, Carter BC, Lex SA, King SJ, Gross SP. Nature. 2004;427:649. - PubMed
    1. Wang Z, Sheetz MP. Cell Struct Funct. 1999;24:373. - PubMed
    1. Ross JL, Wallace K, Shuman H, Goldman YE, Holzbaur ELF. Nat Cell Biol. 2006;8:562. - PubMed

Publication types