. 2008 Jan 18;319(5861):304-9.
doi: 10.1126/science.1151695.

Lhx2 selector activity specifies cortical identity and suppresses hippocampal organizer fate

Affiliations

Lhx2 selector activity specifies cortical identity and suppresses hippocampal organizer fate

Vishakha S Mangale et al. Science. .

Abstract

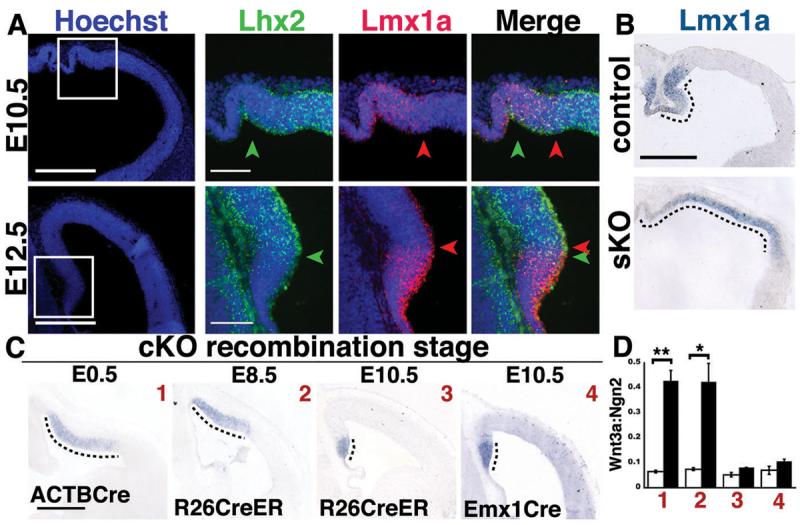
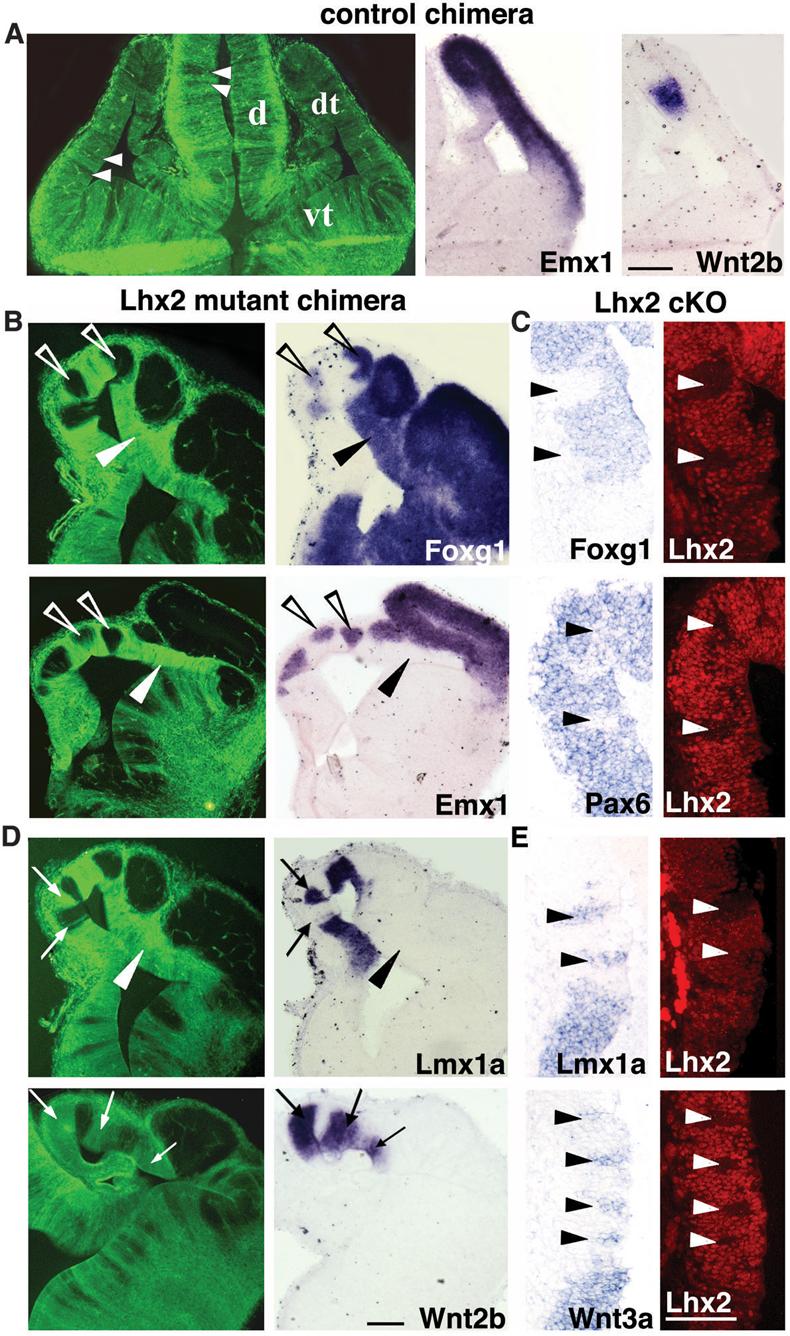
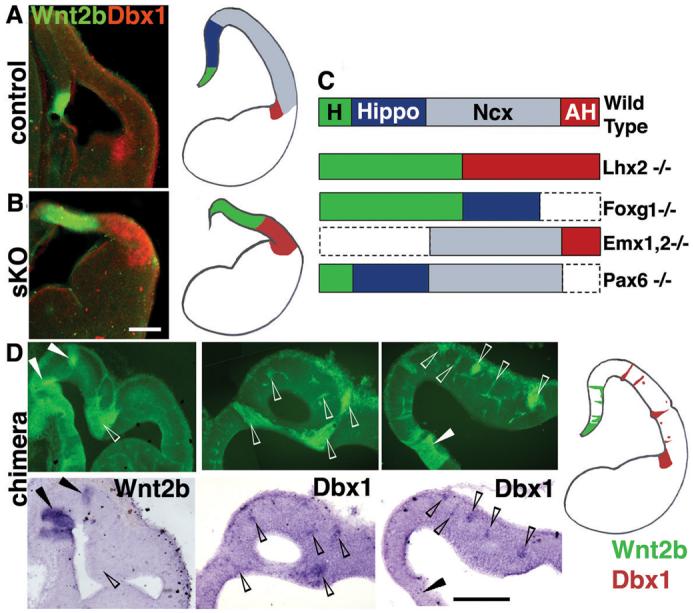
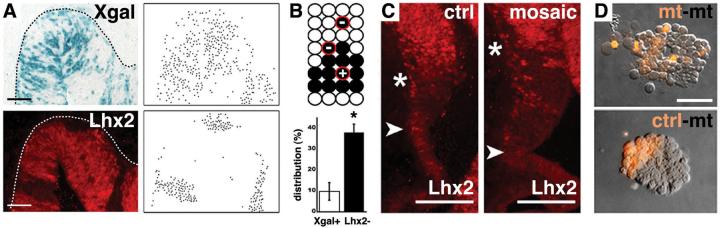
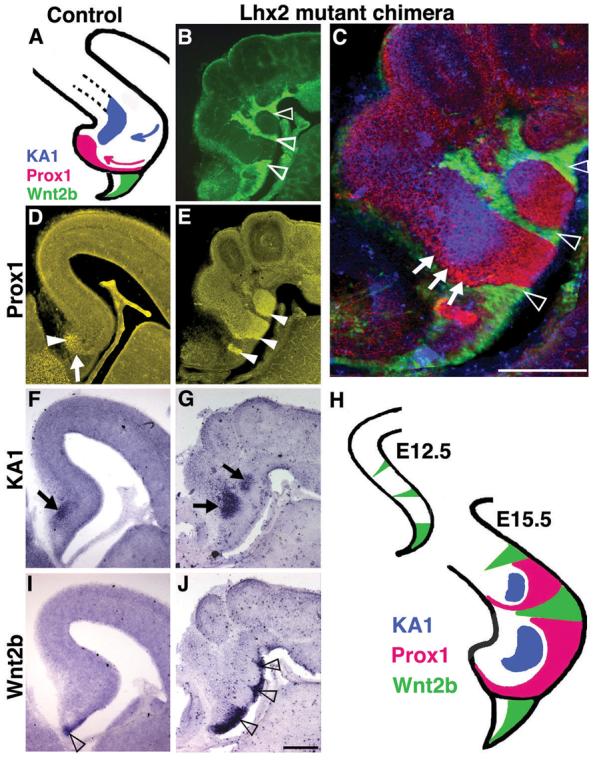
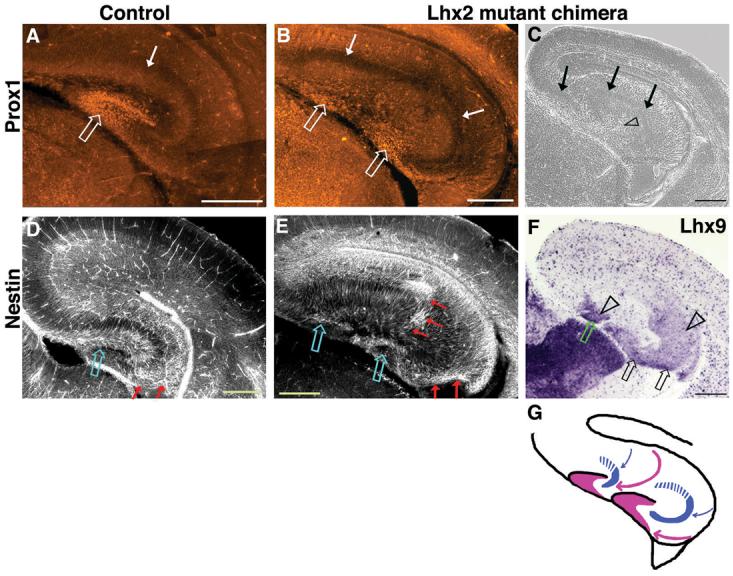
The earliest step in creating the cerebral cortex is the specification of neuroepithelium to a cortical fate. Using mouse genetic mosaics and timed inactivations, we demonstrated that Lhx2 acts as a classic selector gene and essential intrinsic determinant of cortical identity. Lhx2 selector activity is restricted to an early critical period when stem cells comprise the cortical neuroepithelium, where it acts cell-autonomously to specify cortical identity and suppress alternative fates in a spatially dependent manner. Laterally, Lhx2 null cells adopt antihem identity, whereas medially they become cortical hem cells, which can induce and organize ectopic hippocampal fields. In addition to providing functional evidence for Lhx2 selector activity, these findings show that the cortical hem is a hippocampal organizer.


Figures

Figure 1
Figure 1
Hem fate suppression by Lhx2 during an E8.5-E10.5 critical period. (A) Double fluorescent ISH, boxed regions enlarged (right). At E10.5, cortical (Lhx2, green) and hem (Lmx1, red) markers overlap. By E12.5, this overlap is reduced (arrowheads). Scale bars: 100 μm (Hoechst panels, 300 μm). (B) Lmx1a ISH. By E10.5, the excessive hem phenotype (dotted lines) is present in Lhx2 sKO mutants. Scale bar: 300 μm. (C) Temporal inactivation studies; Wnt3a ISH. E12.5 cKO hem expansion (dotted lines) is similar following E0.5 (ACTBCre) or E8.5 inactivations (R26CreER), but inapparent after E10.5 inactivations (R26CreER or Emx1Cre). Scale bar: 300 μm. (D) Quantification of hem:dorsal telencephalon area ratios (Wnt3a:Ngn2 areas). White bars, littermate controls; black bars, Lhx2 cKO mutants; error bars, SEM; t-test, * p<0.05; **p<0.005. Unless otherwise noted, all images henceforth are coronal sections, medial left.
Figure 2
Figure 2
Cell-autonomous cortex-to-hem fate transformation in Lhx2 null mosaics. (A) In control ESC chimeras, GFP-expressing cells intermix randomly with host cells, and dorsal telencephalic patterning is normal. (B,C) Lhx2 null cells in mutant ESC chimeras (GFP-positive cells in B) or in tamoxifen-generated cKO mosaics (Lhx2 negative patches in C) do not express Foxg1, Emx1, or Pax6 in medial cortical regions (arrowheads in C). Surrounding wild-type cells express these markers (open arrowheads in B). Laterally, Lhx2 null cells express Foxg1, but not Emx1 (black arrowheads in B). (D,E) Lhx2 null cells express cortical hem markers Lmx1a, Wnt2b, and Wnt3a medially (arrows in D, arrowheads in E), but not laterally in the dorsal telencephalon (arrowheads in D). Scale bars: 100 μm. d, diencephalon; dt, dorsal telencephalon; vt, ventral telencephalon.
Figure 3
Figure 3
Hem and antihem fate expansion in Lhx2 sKO and ESC chimeras. (A) In E12.5 controls, a false-color overlay of Wnt2b (green) and Dbx1 (red) expression shows hem and antihem domains separated widely by the relatively large cortical (neocortical and hippocampal) neuroepithelium. (B) In E12.5 Lhx2 sKO brains, hem (green) and antihem (red) are both expanded and meet with no intervening cortical neuroepithelium. (C) Schematics of mutant dorsal telencephalic phenotypes illustrating how the complete absence of hippocampus and neocortex is unique to the Lhx2 mutant (4, 5, 28-30). AH, antihem; H, hem; Hippo, hippocampus; Ncx, neocortex. (D) Lhx2 null cells in ESC chimeras express Wnt2b medially (arrowheads) and Dbx1 laterally (open arrowheads), confirming ectopic cell-autonomous adoption of hem and antihem identity, respectively. GFP Images in D are assembled from multiple frames. Scale bars: 200 μm.
Figure 4
Figure 4
Lhx2 on-off state confers differential cell affinity. E12.5 mosaic (Lhx2cKO/sKO;R26CreER/fl) and control (Lhx2cKO/+;R26CreER/fl) littermates after 5 μg/gm TM injection on E5.5. (A) Xgal (blue) and Lhx2 IHC (red), with corresponding dot panels. Xgal-positive cells in mosaic animals are scattered, whereas Lhx2 negative cells in mosaics form contiguous patches. Dotted lines designate pial surfaces. Scale bar: 50 μm. (B) Quantification of recombined cells (black circles) completely isolated from non-recombined cells. The percentage of completely isolated Xgal+ cells in Lhx2 cKO mosaic embryos (9.8%) was similar to that calculated in R26R embryos lacking the Lhx2 cKO allele (8.5%). (C) Lhx2 IHC. Compared to controls, the medial Lhx2 negative domain (between arrowhead and asterisk) in mosaic embryos is enlarged. Scale bar: 100 μm. (D) Three hour in vitro aggregation (21) of E14.5 Emx1Cre;Lhx2 cKO mutant and control littermate cells. Cells in mutant-mutant mixes distribute randomly, whereas cells in mutant-control mixes segregate into discrete clusters. Scale bar: 25 μm.
Figure 5
Figure 5
Multiple hippocampal fields induced by ectopic hem cells in Lhx2 null ESC chimeras. (A,D,F,I) At E15.5, control Prox1 positive dentate granule cells (arrowhead in D) have accumulated after migrating along a curved trajectory (pink arrow in A, arrow in D). KA1 expression (arrow in F) identifies the adjacent hippocampal field CA3. Wnt2b-expressing cortical hem is reduced to the fimbrial ventricular surface (open arrowhead in I). (B,E,G,J) In mutant chimeras, GFP expression and Prox1 staining (same section) show dentate cells (arrowheads in E) juxtaposed to Lhx2 mutant patches (open arrowheads in B,C) and an adjacent region of KA1 expression (arrows in G). Lhx2 mutant patches express Wnt2b in the ventricular zone (open arrowheads in J). (C,H) Overlay of (B,E,G) shows Prox1 expressing cells arranged around the KA1 patch, suggestive of a migrating stream (arrows, C). Images in B and C assembled from multiple frames. Scale bars: 300 μm.
Figure 6
Figure 6
Structural organization of ectopic hippocampi in Lhx2 null ESC chimeras. (A-B) At E17.5, Prox1 immunostaining labels the control dentate gyrus and two morphologically distinct dentate gyri in the mutant chimeric brain (open arrows). (C) A phase contrast image of an adjacent section reveals that the normally continuous cell-dense layer of the CA fields has split in the chimeric brain (arrows). (F) This split layer corresponds to two distinct Ammon's horns, labeled by CA3+DG marker Lhx9. (D,E) Nestin immunostaining labels the control radial glial palisade and marks two such palisades in the mutant chimera, which take a curved trajectory (red arrows) from the ventricular zone, terminating adjacent to the two dentate gyri (open arrows). (G) Schematic of migration paths in chimeric brain (pink arrows, dentate; blue arrows, CA1/CA3). Images in A,B,D,E were assembled from multiple frames.

Comment in

References

    1. Garcia-Bellido A. Ciba Found Symp. 1975;0:161. - PubMed
    1. Irvine KD, Rauskolb C. Annu Rev Cell Dev Biol. 2001;17:189. - PubMed
    1. Lawrence PA, Struhl G. Cell. 1996 Jun 28;85:951. - PubMed
    1. Monuki ES, Porter FD, Walsh CA. Neuron. 2001 Nov 20;32:591. - PubMed
    1. Bulchand S, Grove EA, Porter FD, Tole S. Mech Dev. 2001 Feb;100:165. - PubMed

Publication types

MeSH terms