. 2008 Jan;178(1):157-69.
doi: 10.1534/genetics.107.079780.

Regulation of serotonin biosynthesis by the G proteins Galphao and Galphaq controls serotonin signaling in Caenorhabditis elegans

Affiliations

Regulation of serotonin biosynthesis by the G proteins Galphao and Galphaq controls serotonin signaling in Caenorhabditis elegans

Jessica E Tanis et al. Genetics. 2008 Jan.

Abstract

To analyze mechanisms that modulate serotonin signaling, we investigated how Caenorhabditis elegans regulates the function of serotonergic motor neurons that stimulate egg-laying behavior. Egg laying is inhibited by the G protein Galphao and activated by the G protein Galphaq. We found that Galphao and Galphaq act directly in the serotonergic HSN motor neurons to control egg laying. There, the G proteins had opposing effects on transcription of the tryptophan hydroxylase gene tph-1, which encodes the rate-limiting enzyme for serotonin biosynthesis. Antiserotonin staining confirmed that Galphao and Galphaq antagonistically affect serotonin levels. Altering tph-1 gene dosage showed that small changes in tph-1 expression were sufficient to affect egg-laying behavior. Epistasis experiments showed that signaling through the G proteins has additional tph-1-independent effects. Our results indicate that (1) serotonin signaling is regulated by modulating serotonin biosynthesis and (2) Galphao and Galphaq act in the same neurons to have opposing effects on behavior, in part, by antagonistically regulating transcription of specific genes. Galphao and Galphaq have opposing effects on many behaviors in addition to egg laying and may generally act, as they do in the egg-laying system, to integrate multiple signals and consequently set levels of transcription of genes that affect neurotransmitter release.


Figures

F<sc>igure</sc> 1.—
Figure 1.—
Visualization of neurons and muscles in the egg-laying system of living animals. (A) Confocal image of the egg-laying system with each cell type expressing a different fluorescent protein. (B–D) Images from the same animal as in A showing the different fluorescence channels individually to demonstrate promoter specificity. (B) Red fluorescent protein (DsRed2) expression driven by the HSN-specific promoter. (C) GFP expression driven by the VC-specific promoter. (D) CFP expression driven by the ELM-specific promoter. (E) Bright-field image of the same animal. In B and C, arrowheads indicate cell bodies and boxes surround regions that contain synaptic varicosities; in B–E, asterisks specify the position of the vulva; and in E, the bracket identifies an egg. Bars, 10 μm. Some of the cells that make up the egg-laying system cannot be seen in these images. The HSNs are a pair of bilaterally symmetric neurons, and only the left cell (HSNL) is seen in A and B. The two VC cell bodies visible in A and C are VC4 and VC5. Three additional VC cell bodies lie anteriorly, and one posteriorly to the field of view shown. Of the 16 total ELM cells, those visible in A and D are the two left vm1 and the two left vm2 cells (each vm2 lies over a vm1 and each vm1/vm2 pair appears as a single unit in the two-dimensional images shown). vm1 and vm2 cells on the right side of the animal are outside of the focal planes imaged. The uterine muscle cells are very thin ELM cells that show weak CFP fluorescence and are also out of view in A and D.
F<sc>igure</sc> 2.—
Figure 2.—
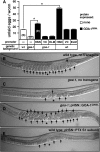
GOA-1 functions in the HSNs to inhibit egg laying. (A) Average number of eggs retained by wild-type animals, goa-1 mutants, and transgenic animals in which GOA-1Q205L was expressed in the individual cell types of the egg-laying system. Expression of GOA-1Q205L in the HSNs rescued the hyperactive egg-laying phenotype of the goa-1 mutant and reduced egg laying in the wild-type background, causing retention of many unlaid eggs. n = 30 for each measurement. Error bars show 95% confidence intervals and asterisks indicate P < 0.0001. The goa-1(n1134) partial loss-of-function mutant was used here and throughout the rest of this work, except where otherwise specified. (B–D) Representative animals corresponding to the genotypes measured by bars labeled B–D in A. In B–E, arrows point to unlaid eggs; asterisks indicate the vulva. (E) Wild-type animal with the catalytic subunit of PTX expressed specifically in the HSNs to inactivate GOA-1. This phenocopies the hyperactive egg-laying behavior seen in the goa-1 loss-of-function mutant (compare to C).
F<sc>igure</sc> 3.—
Figure 3.—
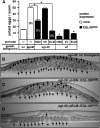
EGL-30 functions in the HSNs and ELMs to stimulate egg laying. (A) Average number of eggs retained by wild-type animals, egl-30 mutants, and transgenic animals in which EGL-30Q205L was expressed individually in the cells of the egg-laying system. Expression of EGL-30Q205L in the HSNs led to partial rescue of the egl-30 mutant phenotype, while expression in the ELMs resulted in full rescue. Expression of EGL-30Q205L in the HSNs or ELMs in a wild-type background resulted in strong stimulation of egg laying. n = 30 for each measurement. Asterisks over brackets indicate values significantly different from the egl-30 control, while asterisks over individual bars indicate values that are significantly different from the wild-type control (P < 0.0001). Error bars show 95% confidence intervals. The egl-30(n686) partial loss-of-function mutant was used here and throughout the rest of this work. (B–D) Representative animals corresponding to the genotypes measured by bars labeled B–D in A. Arrows point to unlaid eggs; asterisks indicate the vulva.
F<sc>igure</sc> 4.—
Figure 4.—
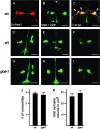
Morphology and synaptobrevin∷GFP labeling of presynaptic varicosities in the HSNs of wild-type and goa-1 mutant animals. (A) DsRed2 and (B) synaptobrevin∷GFP (SNB-1∷:GFP) expressed in a wild-type HSNL. (C) Merge, with nonsynaptic regions indicated by brackets, and three synaptic varicosities indicated by arrowheads. This image corresponds with the boxed region in Figure 1B. The green line between the two small arrows in B, also seen in C–I, is an artifact caused by the vulval slit, and not GFP fluorescence. (D–I) Representative images of SNB-1∷GFP in the HSNL process. (D–F) Wild-type and (G–I) goa-1 mutant synapses. The three examples for each genotype demonstrate the variability in the morphology, location, and size of the synapses. (A–I) Bar, 5 μm. (J) The average number of SNB-1∷GFP varicosities is not significantly different in goa-1 mutants compared to the wild type (P = 0.66). (K) Total synaptic volume (μm3) per HSN is not significantly different in goa-1 mutants compared to the wild type (P = 0.37). In J and K, error bars indicate standard error; n ≥ 8 for all measurements.
F<sc>igure</sc> 5.—
Figure 5.—
GOA-1 and EGL-30 regulate expression of a tph-1 reporter transgene. (A) Average intensity of DsRed2 driven by the tph-1 promoter and GFP driven by the unc-86 promoter in wild-type, goa-1, and egl-30 animals. The intensity of DsRed2 expressed from the tph-1 promoter was greater in goa-1 mutants compared to the wild type, while the intensity was much lower in egl-30 mutants. The intensity of the GFP expressed from the unc-86 promoter was not significantly different in goa-1 or egl-30 mutants compared to the wild type. For A and F–H, n = 30 for each genotype, error bars show 95% confidence intervals, and asterisks indicate values significantly different from the respective control (P < 0.0001). The fluorescence unit scales shown in different panels cannot be directly compared as different microscope settings were used. (B–E) Representative images of DsRed2 expression in HSNL cell bodies from (B) the wild type, (C) goa-1, and (D) egl-30. (E) The same egl-30 HSNL cell body as seen in D imaged with increased gain to show the presence of the HSNL cell body. (B–E) Bar, 3 μm. (F) Inactivating GOA-1 in the HSN neurons by expressing the catalytic subunit of PTX from the HSN-specific promoter results in a significant increase in expression of DsRed2 from the tph-1 promoter. (G) Expression of GOA-1Q205L in the HSNs of the goa-1 mutant decreases expression of DsRed2 from the tph-1 promoter. (H) Expression of EGL-30Q205L in the HSNs of the egl-30 mutant increases expression of DsRed2 from the tph-1 promoter.
F<sc>igure</sc> 6.—
Figure 6.—
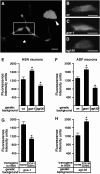
GOA-1 and EGL-30 regulate serotonin levels in the HSN and ADF neurons. (A) Antiserotonin staining in a wild-type HSNL. Arrowhead indicates the HSN cell body, a box surrounds the region that contains synaptic varicosities, and the asterisk specifies the position of the vulva. (B–D) Representative images of serotonin staining in HSN cell bodies from (B) the wild type, (C) the goa-1(sa734) null mutant, and (D) the egl-30 mutant. (A–D) Bar, 5 μm. (E) Mean intensity of serotonin staining in the HSNs of wild-type, goa-1(sa734), and egl-30 animals. The serotonin level in the HSNs of the goa-1 mutant was significantly higher than in the wild type, while the serotonin level was significantly lower in the egl-30 mutant. n > 24 for all genotypes. In E–H, the fluorescence unit scales cannot be directly compared as different microscope settings were used; error bars show 95% confidence intervals and asterisks indicate values that are significantly different from the respective controls (P < 0.01). (F) Mean intensity of serotonin staining in the ADFs of wild-type, goa-1(sa734), and egl-30 animals. The serotonin level in the ADFs of the goa-1 mutant was significantly higher than in the wild type, while the serotonin level was significantly lower in the egl-30 mutant. n = 30 for all genotypes. (G) Expression of GOA-1Q205L in the HSNs of the goa-1(n1134) mutant significantly decreases serotonin levels in the HSNs. (H) Expression of EGL-30Q205L in the HSNs of the egl-30 mutant significantly increases serotonin levels in the HSNs. In G and H, n = 30 for all genotypes.
F<sc>igure</sc> 7.—
Figure 7.—
Changes in tph-1 expression account, in part, for regulation of egg laying. (A) Model in which GOA-1 and EGL-30 function antagonistically in the HSNs to regulate expression from the tph-1 promoter and serotonin levels to control the amount of serotonin release and egg-laying behavior. (B) Average number of unlaid eggs in animals carrying various doses of the tph-1 gene (n = 60 for each genotype). (+) indicates a wild-type copy of tph-1; (Ø) stands for tph-1(mg280), the canonical null allele of tph-1. All animals in this experiment were also heterozygous for the recessive marker mutation unc-4(e120), which was necessary to verify some genotypes and was included in the others for consistency. Error bars indicate 95% confidence intervals and asterisks indicate significant differences (P < 0.0001). (C) The average number of unlaid eggs per animal (n = 60 for each genotype); error bars and significance were determined as in B. Dp, the chromosomal duplication arDp2, which duplicates part of chromosome II, including tph-1. The duplication causes the animals used in C to not be genotypically matched to those used in B, accounting for the differences between the control animals (two copies of tph-1) in the two separate experiments. (D) Average number of eggs retained by wild-type animals and transgenic tph-1 null mutants in which the tph-1 cDNA plus GFP or GFP alone was expressed from either the HSN or the NSM cell-specific promoter. Expression of the tph-1 cDNA from the HSN promoter led to partial rescue of the tph-1 mutant phenotype, while expression from the NSM promoter did not result in rescue. n = 50 for all genotypes (10 animals from five independent transgenic lines). The asterisk over the bracket indicates a significant difference from the respective tph-1 null control (P < 0.0001). Error bars show 95% confidence intervals. (E) Average number of eggs retained by wild-type animals, tph-1 mutants, and transgenic animals expressing PTX or EGL-30Q205L in the HSNs in either a wild-type or a tph-1 background. Expression of either PTX or EGL-30Q205L in the HSNs led to the retention of fewer unlaid eggs compared to the nontransgenic controls, even in the tph-1 null mutant. n = 30 for all genotypes. Error bars show 95% confidence intervals and asterisks indicate values significantly different from the nontransgenic controls (P < 0.0001).

Similar articles

Cited by

References

    1. Adler, C. E., R. D. Fetter and C. I. Bargmann, 2006. UNC-6/netrin induces neuronal asymmetry and defines the site of axon formation. Nat. Neurosci. 9: 511–518. - PMC - PubMed
    1. Bany, I. A., M. Q. Dong and M. R. Koelle, 2003. Genetic and cellular basis for acetylcholine inhibition of Caenorhabditis elegans egg-laying behavior. J. Neurosci. 23: 8060–8069. - PMC - PubMed
    1. Bastiani, C. A., S. Gharib, M. I. Simon and P. W. Sternberg, 2003. Caenorhabditis elegans Gαq regulates egg-laying behavior via a PLCβ-independent and serotonin-dependent signaling pathway and likely functions both in the nervous system and in muscle. Genetics 165: 1805–1822. - PMC - PubMed
    1. Brenner, S., 1974. The genetics of Caenorhabditis elegans. Genetics 77: 71–94. - PMC - PubMed
    1. Brundage, L., L. Avery, A. Katz, U. J. Kim, J. E. Mendel et al., 1996. Mutations in a C. elegans Gqα gene disrupt movement, egg laying, and viability. Neuron 16: 999–1009. - PMC - PubMed

Publication types

MeSH terms

Substances