. 2008 Jan;178(1):259-72.
doi: 10.1534/genetics.107.081893.

An unstable targeted allele of the mouse Mitf gene with a high somatic and germline reversion rate

Affiliations

An unstable targeted allele of the mouse Mitf gene with a high somatic and germline reversion rate

Keren Bismuth et al. Genetics. 2008 Jan.

Abstract

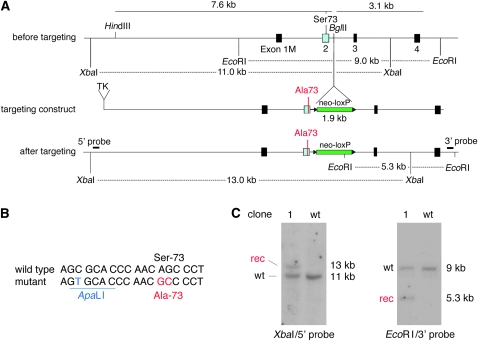
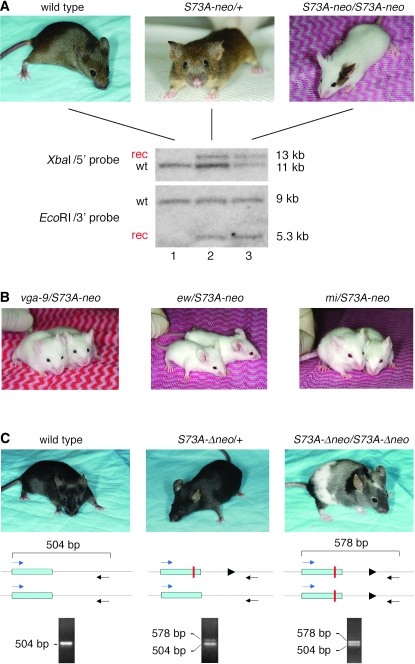
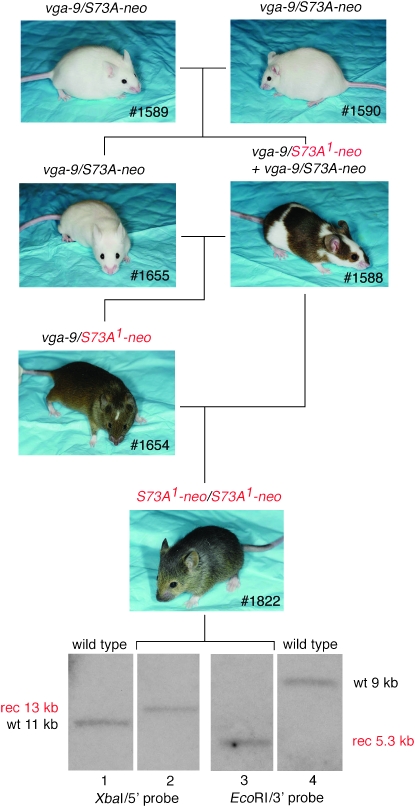
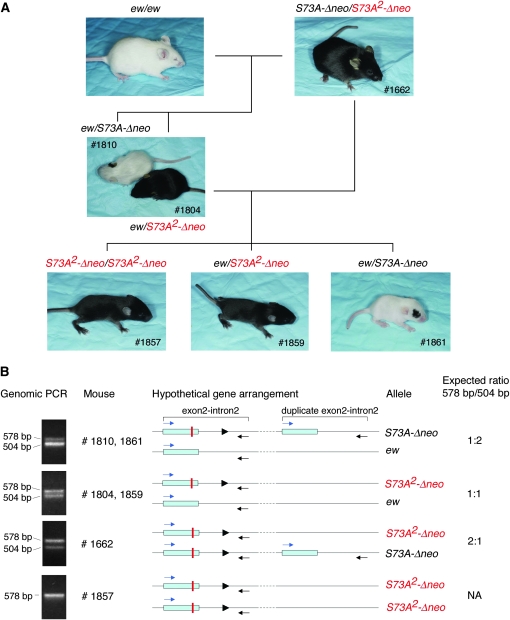
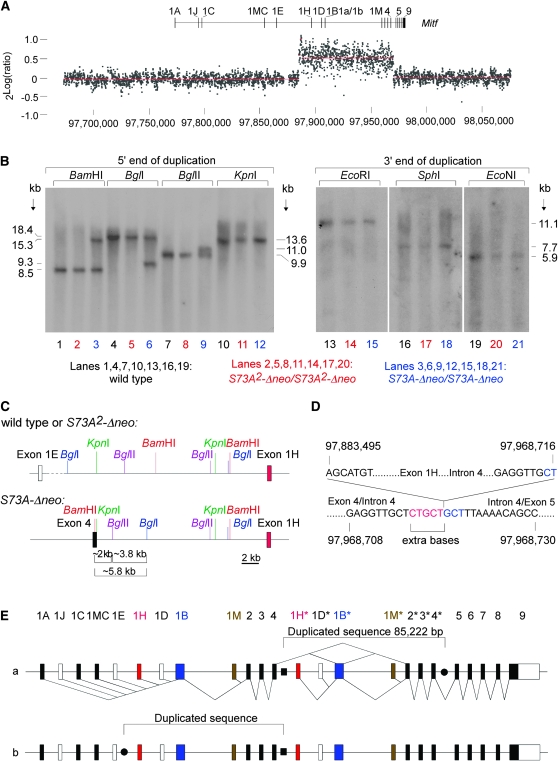
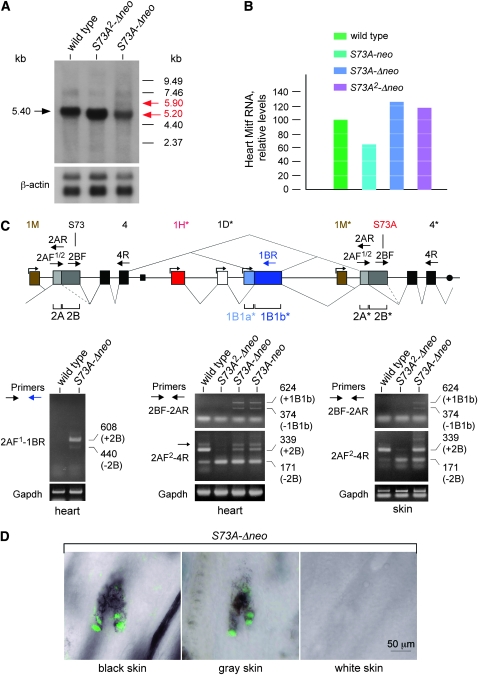
The mouse Mitf gene encodes a transcription factor that is regulated by serine phosphorylation and is critical for the development of melanin-containing pigment cells. To test the role of phosphorylation at a particular serine, S73 in exon 2 of Mitf, we used a standard targeting strategy in mouse embryonic stem cells to change the corresponding codon into one encoding an alanine. By chance, we generated an allele in which 85,222 bp of wild-type Mitf sequence are duplicated and inserted into an otherwise correctly targeted Mitf gene. Depending on the presence or absence of a neomycin resistance cassette, this genomic rearrangement leads to animals with a white coat with or without pigmented spots or a gray coat with obligatory white and black spots. Several independent, genetically stable germline revertants that lacked the duplicated wild-type sequence but retained the targeted codon were then derived. These animals were normally pigmented, indicating that the serine-to-alanine mutation is not deleterious to melanocyte development. The fact that mosaic coat reversions occur in all mice lacking the neo-cassette and that approximately 1% of these transmit a reverted allele to their offspring places this mutation among those with the highest spontaneous reversion rates in mammals.


Figures

F<sc>igure</sc> 1.—
Figure 1.—
Targeting construct and analysis of a targeted ES clone. (A) Schematic of a portion of the mouse Mitf gene and targeting construct. (Top) The genomic region before targeting around exon 1M–4, the position of S73 in exon 2, the position of the BglII site where the neo-cassette will be inserted, and the position of the EcoRI and XbaI restriction sites used to identify legitimate recombination events. (Middle) The targeting construct, consisting (in the 5′–3′ direction) of a TK cassette, 7.6 kb of 5′ flanking sequence containing a modified codon, the neocassette (green) flanked by loxP sites (triangles), and 3.1 kb of 3′ flanking sequence. (Bottom) The genomic arrangement after targeting, showing the position of the diagnostic restriction fragments and the position of the probes used for Southern hybridization. The XbaI fragment in wild type is 11 kb but after targeting is increased to 13 kb because of the insertion of the neo-cassette. The EcoRI fragment in wild type is 9 kb and, after targeting, a novel EcoRI fragment of 5.3 kb is generated because of an EcoRI site in the neo-cassette. (B) Wild-type and modified sequence around S73. The mutant contains a silent ApaLI site and an AGC-to-GCC codon change, leading to a Ser-73-to-Ala change. (C) Analysis of wild-type and clone 1 ES cells by Southern hybridization. Note the expected recombinant bands after indicated restriction cuts and hybridization with the indicated probes.
F<sc>igure</sc> 2.—
Figure 2.—
Breeding of targeted mice and color change after removal of the neo-cassette. (A) Coat appearance of wild type, heterozygous, and homozygous S73A-neo mice and corresponding genomic Southern analyses. Both wild-type and heterozygous mice are normally pigmented while homozygotes are largely white except for pigmented spots seen in 15–20% of the animals as shown in the example. Genomic DNA was digested and probed as described in Figure 1 for ES cells. The targeted heterozygous mouse shows the expected Southern pattern (although with different intensities for the wild-type and recombinant bands, particularly clear with XbaI and the 5′ probe) and the homozygous mouse shows wild-type and recombinant bands of equal intensities. (B) Compound heterozygotes of the indicated genotypes are white mice. (C). After Cre-mediated recombination to remove the neo-cassette, homozygous mice (labeled S73A-Δneo/S73A-Δneo) are largely gray but have extensive white spotting and at least one darkly pigmented area. Also, they retain a wild-type PCR band as indicated at the bottom of the figure. The solid triangles represent the loxP site. For details, see text.
F<sc>igure</sc> 3.—
Figure 3.—
Phenotypic reversion, event 1. The crossing of two vga-9/S73A-neo compound heterozygotes led to an extensively pigmented mouse (#1588) that apparently was mosaic for a novel Mitf allele, S73A1-neo, and that gave rise to phenotypically and genotypically different offspring. Using the indicated breeding scheme, a mouse (#1822) homozygous for S73A1-neo, was generated. Genomic Southern hybridization as described in Figure 1 indicated that this mouse lost the extraneous wild-type band but retained the targeted recombinant band.
F<sc>igure</sc> 4.—
Figure 4.—
Phenotypic reversion, event 2. (A) The crossing of two ew/S73A-Δneo compound heterozygotes (not shown) generated a mouse (#1662), which was fully pigmented. This mouse carried a novel Mitf allele, S73A2-Δneo, that could be bred to homozygosity using the indicated breeding scheme. The presence of S73A2-Δneo renders mice fully pigmented even if their second Mitf allele is ew, a strong Mitf allele. (B) Genomic PCR of the indicated mice, using PCR primers as in Figure 2. The analysis indicates that #1857 contains only the targeted band of 578 bp, while the other mice all contain both the wild-type 504-bp band and the targeted 578-bp band, although at different relative intensities. A hypothetical gene rearrangement and the expected ratios of the two bands, consistent with the PCR results, are shown on the right. The solid triangles represent the loxP site.
F<sc>igure</sc> 5.—
Figure 5.—
Two-color FISH. (A) Schematic of the entire Mitf gene containing 17 exons and spanning ∼214 kb. The position of the BAC probe (red) covering the 5′ portion of the gene is shown, as is the position of the 12.6-kb targeting construct probe (green), covering exons 1M–4. (B) Metaphase spreads were prepared from spleen cells harvested from homozygous mice of the indicated genotypes. The red signal is of equal strength regardless of genotype. Also, compared to cells still containing the extra wild-type sequence (S73A-neo and S73A-Δneo), the green signal is weaker in cells from mice that have lost the wild-type band (S73A1-neo and S73A2-Δneo). Chromosome banding (not shown) indicates that the signals are on chromosome 6 at a location where Mitf is expected.
F<sc>igure</sc> 6.—
Figure 6.—
Molecular analysis of the duplication. (A) A fine-tiling custom CGH array spanning the indicated region of chromosome 6 (based on sequence release NCBIM:36) was cohybridized with Cy3-labeled DNA from homozygous S73A2-Δneo mice and with Cy5-labeled DNA from S73A-Δneo mice. A copy number difference is seen for a sequence approximately covering positions 97,883,500–97,968,700, extending from upstream of exon 1H to a position between exon 4 and 5. (B) Southern analysis using probes corresponding to the 5′- and 3′-end of the duplication (left and right, respectively). Probing with the 5′ probe reveals RFLPs in DNA from S73A-Δneo for BamHI, BglI, and BglII, but not for KpnI. Probing with the 3′ probe shows no RFLPs between the different DNAs. (C) Restriction map for wild type or S73A2-Δneo (top) or for S73A-Δneo (bottom) on the basis of the above Southern analyses. The novel restriction fragments indicate the presence of a BamHI–KpnI–BglII–BglI constellation that happens to be present in intron 4 of Mitf. (D) Junction sequences of the inserted partial gene duplication in S73A-Δneo. Five extra bases (red) are found between the intron 4/upstream exon 1H junction. The downstream junction in intron 4 reads exactly like the wild-type sequence. Interestingly, the sequence marked in blue is a direct repeat of the extra sequence marked in red. (E) Two possible arrangements of the insertions of the duplicate. The novel intron 4/upstream exon 1H junction is marked by a solid square, and the potential other junctions by solid circles. In a, the duplicate spanning exons 1H–4 (marked with asterisks) is inserted into intron 4. In b, the duplicate is inserted between exons 1E and 1H. The two possible arrangements, however, are sequence identical. Splice patterns (known and predicted following the insertion of the duplicate) are indicated only for version a.
F<sc>igure</sc> 7.—
Figure 7.—
Mitf transcript analyses with the mutated gene before and after resolution of the sequence rearrangement. (A) Northern analysis of total RNA harvested from heart of wild-type mice and S73A2-Δneo and S73A-Δneo homozygotes. The blots were probed with a radiolabeled Mitf cDNA. A single major band of 5.4 kb is in wild type and a single major band of 5.2 kb is in S73A2-Δneo and S73A-Δneo RNA. In addition, a barely visible minor band of ∼5.9 kb is seen only in S73A-Δneo RNA, along with a presumably unspecific minor band at ∼7.46 kb present regardless of genotype. (B) Quantitation of RNA levels in heart of the indicated genotypes by real-time PCR, using primers in exon 8 and exon 9 common to all Mitf RNAs. After normalization for Gapdh levels, there is a relative reduction in Mitf RNA levels in the presence of the neo-cassette and a relative increase in Mitf levels in the absence of the cassette. (C, top) Schematic of the splice patterns around the duplication. Both exons 2 and 1B are bipartite, and exons 1M, 1H, 1D, and 1B1a each have their own promoters (indicated by small forward arrows). The relative position of primers (larger forwardand reverse arrows) is indicated on top of exons 2A, 2B, 4, 1B1b*, 2A*, 2B*, and 4*. (Bottom left) Wild type and S73A-Δneo RNA were amplified with the indicated primers to demonstrate that exon 4 splices into exon 1B1b* only in S73A-Δneo as predicted from the genomic rearrangement. Two bands that differ in the presence or absence of the alternatively spliced exon 2B are visible. Furthermore, their sequence is wild type at S73, indicating that the wild-type exon 2B is located upstream of 1B1b*. (Bottom middle) Heart RNA of the indicated genotypes was analyzed with primers 2BF and 2AR to demonstrate splicing from exon 4 to exon 2A*. Two products are seen when the duplicate sequence is present. The 624-bp band represents splicing of exon 4 into 1B1b* and 1B1b* into 2A* and the 374-bp band splicing of exon 4 directly into exon 2A*. Primers 2AF2 and 4R were used to analyze the presence and absence of exon 2B. Wild type mostly generates a 339-bp band containing exon 2B while S73A2-Δneo mostly generates a 171-bp band lacking exon 2B. With the duplicated sequence present, the 339-bp band is more prominent. There is also a larger band in heart RNA, indicated by a small arrow, that likely represents a differentially spliced message that was not further analyzed. (Bottom right) The use of the same primer pairs as in the bottom middle shows similar results on skin RNA. The skin of S73A-neo mice was not analyzed as it is mostly white and hence lacks melanocytes, the major contributors to skin Mitf RNA. (D) Indirect immunofluorescence of MITF protein in skin of homozygous S73A-Δneo pups. Cryosections of skin were labeled with a rabbit serum against mouse MITF protein, and black skin, gray skin, and white skin was analyzed separately. Note the normal nuclear appearance of MITF fluorescence in follicular pigment cells except in white skin. The labeling intensity appears slightly higher in black skin compared to gray skin.

Similar articles

Cited by

References

    1. Arnheiter, H., L. Hou, M.-T. T. Nguyen, K. Bismuth, T. Csermely et al., 2006. Mitf—A Matter of Life and Death for the Developing Melanocyte. Humana Press, Totowa, NJ.
    1. Bennett, D. C., and M. L. Lamoreux, 2003. The color loci of mice: a genetic century. Pigment Cell Res. 16: 333–344. - PubMed
    1. Bharti, K., M. T. Nguyen, S. Skuntz, S. Bertuzzi and H. Arnheiter, 2006. The other pigment cell: specification and development of the pigmented epithelium of the vertebrate eye. Pigment Cell Res. 19: 380–394. - PMC - PubMed
    1. Brilliant, M. H., Y. Gondo and E. M. Eicher, 1991. Direct molecular identification of the mouse pink-eyed unstable mutation by genome scanning. Science 252: 566–569. - PubMed
    1. Conrad, B., and S. E. Antonarakis, 2007. Gene duplication: a drive for phenotypic diversity and cause of human disease. Annu. Rev. Genomics Hum. Genet. 8: 17–35. - PubMed

Publication types

MeSH terms