

Loss of LINE-1 activity in the megabats
- PMID: 18202382
- PMCID: PMC2206088
- DOI: 10.1534/genetics.107.080275
Loss of LINE-1 activity in the megabats
Abstract
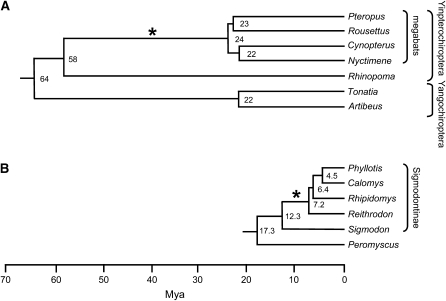
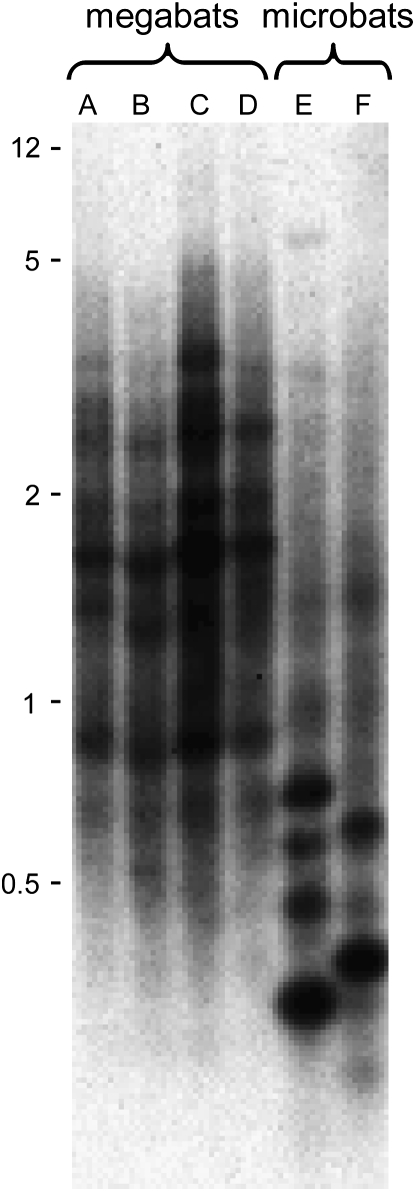
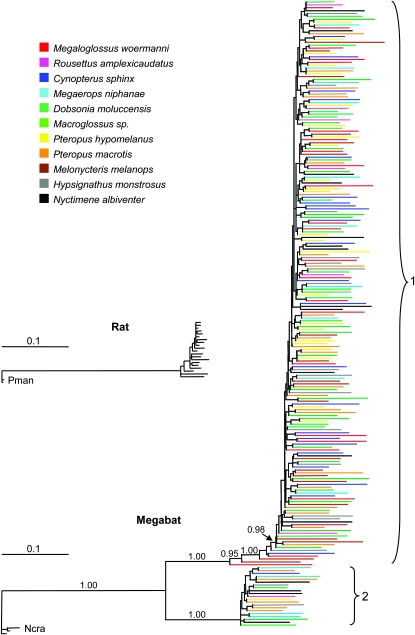
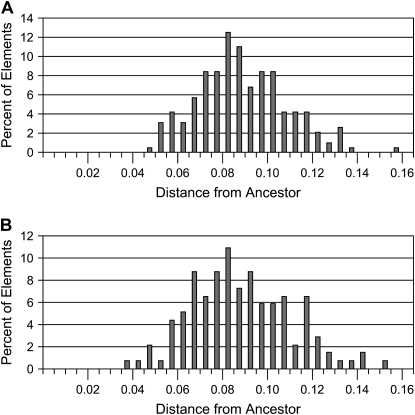
LINE-1 (L1) retrotransposons are the most abundant type of mammalian retroelement. They have profound effects on genome plasticity and have been proposed to fulfill essential host functions, yet it remains unclear where they lie on the spectrum from parasitism to mutualism. Their ubiquity makes it difficult to determine the extent of their effects on genome evolution and gene expression because of the relative dearth of animal models lacking L1 activity. We have isolated L1 sequences from 11 megabat species by a method that enriches for recently inserted L1s and have done a bioinformatic examination of L1 sequences from a 12th species whose genome was recently shotgun sequenced. An L1 extinction event appears to have occurred at least 24 million years ago (MYA) in an ancestor of the megabats. The ancestor was unusual in having maintained two highly divergent long-term L1 lineages with different levels of activity, which appear, on an evolutionary scale, to have simultaneously lost that activity. These megabat species can serve as new animal models to ask what effect loss of L1 activity has on mammalian genome evolution and gene expression.
Figures
References
-
- Adkins, R. M., E. L. Gelke, D. Rowe and R. L. Honeycutt, 2001. Molecular phylogeny and divergence time estimates for major rodent groups: evidence from multiple genes. Mol. Biol. Evol. 18: 777–791. - PubMed
-
- Adkins, R. M., A. H. Walton and R. L. Honeycutt, 2003. Higher-level systematics of rodents and divergence time estimates based on two congruent nuclear genes. Mol. Phylogenet. Evol. 26: 409–420. - PubMed
-
- Alvarez, Y., J. Juste, E. Tabares, A. Garrido-Pertierra, C. Ibanez et al., 1999. Molecular phylogeny and morphological homoplasy in fruitbats. Mol. Biol. Evol. 16: 1061–1067. - PubMed
-
- Ausubel, F. M., R. Brent, R. E. Kingston, D. D. Moore, J. G. Seidman et al. (Editors), 1989. Current Protocols in Molecular Biology. Wiley-Interscience, New York.
Publication types
MeSH terms
Substances
Associated data
- Actions
- Actions
- Actions
- Actions
- Actions
- Actions
- Actions
- Actions
- Actions
- Actions
- Actions
- Actions
- Actions
- Actions
- Actions
- Actions
- Actions
- Actions
- Actions
- Actions
- Actions
- Actions
- Actions
- Actions
- Actions
- Actions
- Actions
- Actions
- Actions
- Actions
- Actions
- Actions
- Actions
- Actions
- Actions
- Actions
- Actions
- Actions
- Actions
- Actions
- Actions
- Actions
- Actions
- Actions
- Actions
- Actions
- Actions
- Actions
- Actions
- Actions
- Actions
- Actions
- Actions
- Actions
- Actions
- Actions
- Actions
- Actions
- Actions
- Actions
- Actions
- Actions
- Actions
- Actions
- Actions
- Actions
- Actions
- Actions
- Actions
- Actions
- Actions
- Actions
- Actions
- Actions
- Actions
- Actions
- Actions
- Actions
- Actions
- Actions
- Actions
- Actions
- Actions
- Actions
- Actions
- Actions
- Actions
- Actions
- Actions
- Actions
- Actions
- Actions
- Actions
- Actions
- Actions
- Actions
- Actions
- Actions
- Actions
- Actions
- Actions
- Actions
- Actions
- Actions
- Actions
- Actions
- Actions
- Actions
- Actions
- Actions
- Actions
- Actions
- Actions
- Actions
- Actions
- Actions
- Actions
- Actions
- Actions
- Actions
- Actions
- Actions
- Actions
- Actions
- Actions
- Actions
- Actions
- Actions
- Actions
- Actions
- Actions
- Actions
- Actions
- Actions
- Actions
- Actions
- Actions
- Actions
- Actions
- Actions
- Actions
- Actions
- Actions
- Actions
- Actions
- Actions
- Actions
- Actions
- Actions
- Actions
- Actions
- Actions
- Actions
- Actions
- Actions
- Actions
- Actions
- Actions
- Actions
- Actions
- Actions
- Actions
- Actions
- Actions
- Actions
- Actions
- Actions
- Actions
- Actions
- Actions
- Actions
- Actions
- Actions
- Actions
- Actions
- Actions
- Actions
- Actions
- Actions
- Actions
- Actions
- Actions
- Actions
- Actions
- Actions
- Actions
- Actions
- Actions
- Actions
- Actions
- Actions
- Actions
- Actions
- Actions
- Actions
- Actions
- Actions
- Actions
- Actions
- Actions
- Actions
- Actions
- Actions
- Actions
- Actions
- Actions
- Actions
- Actions
- Actions
- Actions
- Actions
- Actions
- Actions
- Actions
- Actions
- Actions
- Actions
- Actions
- Actions
- Actions
- Actions
- Actions
- Actions
- Actions
- Actions
- Actions
- Actions
- Actions
- Actions
- Actions
- Actions
- Actions
- Actions
- Actions
- Actions
- Actions
- Actions
- Actions
- Actions
- Actions
- Actions
- Actions
- Actions
- Actions
- Actions
- Actions
- Actions
- Actions
- Actions
- Actions
- Actions
- Actions
- Actions
- Actions
- Actions
- Actions
- Actions
- Actions
- Actions
- Actions
- Actions
- Actions
- Actions
- Actions
- Actions
- Actions
- Actions
- Actions
- Actions
- Actions
- Actions
- Actions
- Actions
- Actions
- Actions
- Actions
- Actions
- Actions
- Actions
- Actions
- Actions
- Actions
- Actions
- Actions
- Actions
- Actions
- Actions
- Actions
- Actions
- Actions
- Actions
- Actions
- Actions
- Actions
- Actions
- Actions
- Actions
Grants and funding
LinkOut - more resources
Full Text Sources
