. 2008 Jan;178(1):427-37.
doi: 10.1534/genetics.107.080432.

Testing for archaic hominin admixture on the X chromosome: model likelihoods for the modern human RRM2P4 region from summaries of genealogical topology under the structured coalescent

Affiliations

Testing for archaic hominin admixture on the X chromosome: model likelihoods for the modern human RRM2P4 region from summaries of genealogical topology under the structured coalescent

Murray P Cox et al. Genetics. 2008 Jan.

Abstract

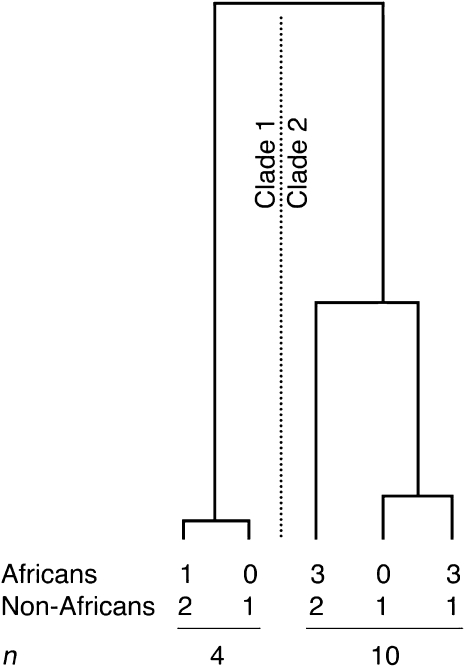
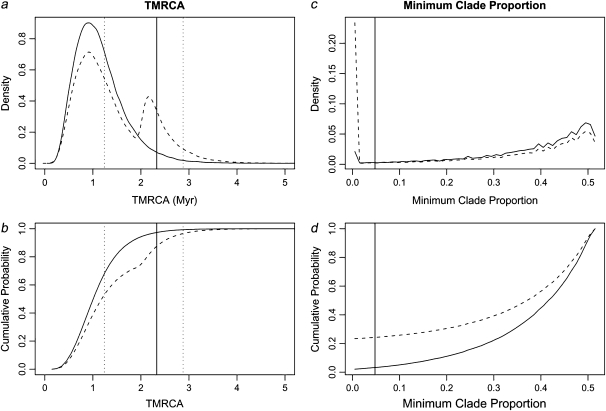
A 2.4-kb stretch within the RRM2P4 region of the X chromosome, previously sequenced in a sample of 41 globally distributed humans, displayed both an ancient time to the most recent common ancestor (e.g., a TMRCA of approximately 2 million years) and a basal clade composed entirely of Asian sequences. This pattern was interpreted to reflect a history of introgressive hybridization from archaic hominins (most likely Asian Homo erectus) into the anatomically modern human genome. Here, we address this hypothesis by resequencing the 2.4-kb RRM2P4 region in 131 African and 122 non-African individuals and by extending the length of sequence in a window of 16.5 kb encompassing the RRM2P4 pseudogene in a subset of 90 individuals. We find that both the ancient TMRCA and the skew in non-African representation in one of the basal clades are essentially limited to the central 2.4-kb region. We define a new summary statistic called the minimum clade proportion (pmc), which quantifies the proportion of individuals from a specified geographic region in each of the two basal clades of a binary gene tree, and then employ coalescent simulations to assess the likelihood of the observed central RRM2P4 genealogy under two alternative views of human evolutionary history: recent African replacement (RAR) and archaic admixture (AA). A molecular-clock-based TMRCA estimate of 2.33 million years is a statistical outlier under the RAR model; however, the large variance associated with this estimate makes it difficult to distinguish the predictions of the human origins models tested here. The pmc summary statistic, which has improved power with larger samples of chromosomes, yields values that are significantly unlikely under the RAR model and fit expectations better under a range of archaic admixture scenarios.


Figures

F<sc>igure</sc> 1.—
Figure 1.—
Location of the RRM2P4 locus on the X chromosome (top bar), positions of the three sequenced regions (middle bar), and placement of the RRM2P4 pseudogene fragments relative to the RRM2P4 central region (bottom bars). Vertical bars in the central region indicate SNPs defining the two basal clades. All coordinates correspond to the human genome UCSC March 2006 build.
F<sc>igure</sc> 2.—
Figure 2.—
Schematics of two demographic models. The recent African replacement (RAR) model grows exponentially from a 104 effective population size at 80 KYA, and 500 individuals found the non-African population at 60 KYA, experience a constant-sized bottleneck for 5 KYA, and grow exponentially from 55 KYA. The ancient admixture (AA) model includes introgression from an ancestral hominin source with constant population size of 103; the population leading to that of anatomically modern humans and ancestral hominins diverged 2 MYA. Modern effective sizes and the intercontinental migration rate were inferred by approximate Bayesian computation.
F<sc>igure</sc> 3.—
Figure 3.—
Schematic of the minimum clade-proportion statistic, pmc. See text for details.
F<sc>igure</sc> 4.—
Figure 4.—
Time-scaled gene tree of the RRM2P4 central region. Polymorphisms are labeled with the nomenclature of Garrigan et al. (2005b) and are equivalent to that publication's Figure 1. Italicized and underlined polymorphisms indicate probable reticulation points. The proportions of African and non-African individuals carrying each lineage are indicated beneath the tree. Note the overrepresentation of non-Africans in the leftmost basal clade (“clade A”). Molecular-clock estimates of the TMRCA and mutation ages are shown in millions of years on the vertical axis.
F<sc>igure</sc> 5.—
Figure 5.—
Distribution and cumulative probability of (a and b) TMRCAs and (c and d) minimum clade proportions under the optimal two-deme RAR model (solid curve) and the corresponding model with 5% introgression from ancestral hominins at 50 KYA (dashed curve). The molecular-clock date is shown by a solid vertical line in a and b; the panmictic and island model dates are shown by dotted vertical lines (to the left and right, respectively). The admixture peak would increase as admixture occurred more frequently and shift right with deeper structure between admixing demes. The observed pmc is illustrated by a solid vertical line in c and d.
F<sc>igure</sc> 6.—
Figure 6.—
Effect of admixture parameters on the minimum clade proportion. Fewer Africans are found in one basal clade as archaic Asian admixture occurs more frequently and more recently. The likelihood surface is generated by interpolation from mean pmc values of 105 simulations at each point in a 10 × 10 grid (dots) covering the parameter space of admixture time and admixture proportion.

References

    1. Anton, S. C., and C. C. Swisher, 2004. Early dispersal of Homo from Africa. Annu. Rev. Anthropol. 33: 271–296.
    1. Barreiro, L. B., E. Patin, O. Neyrolles, H. M. Cann, B. Gicquel et al., 2005. The heritage of pathogen pressures and ancient demography in the human innate-immunity CD209/CD209L region. Am. J. Hum. Genet. 77: 869–886. - PMC - PubMed
    1. Basu, A., and P. Majumdar, 2003. A comparison of two popular statistical methods for estimating the time to most recent common ancestor (TMRCA) from a sample of DNA sequences. J. Genet. 82: 7–12. - PubMed
    1. Beaumont, M. A., W. Zhang and D. J. Balding, 2002. Approximate Bayesian computation in population genetics. Genetics 162: 2025–2035. - PMC - PubMed
    1. Cann, H. M., C. de Toma, L. Cazes, M. F. Legrand, V. Morel et al., 2002. A human genome diversity cell line panel. Science 296: 261–262. - PubMed

Publication types

Substances