. 2008 Jan;178(1):489-511.
doi: 10.1534/genetics.107.077297.

Quantitative trait loci for grain yield and adaptation of durum wheat (Triticum durum Desf.) across a wide range of water availability

Affiliations

Quantitative trait loci for grain yield and adaptation of durum wheat (Triticum durum Desf.) across a wide range of water availability

Marco Maccaferri et al. Genetics. 2008 Jan.

Abstract

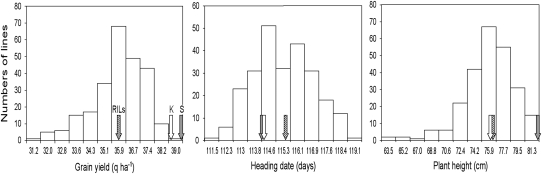
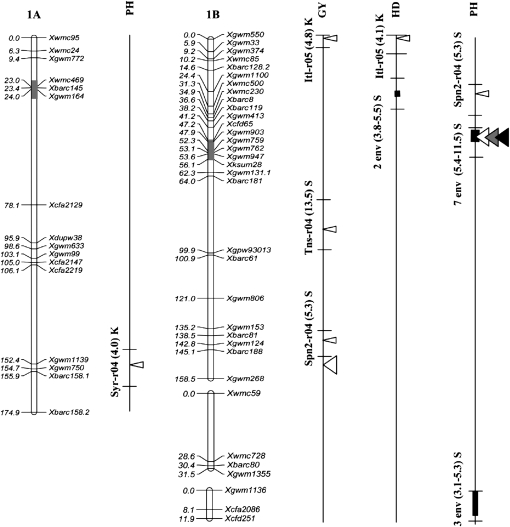
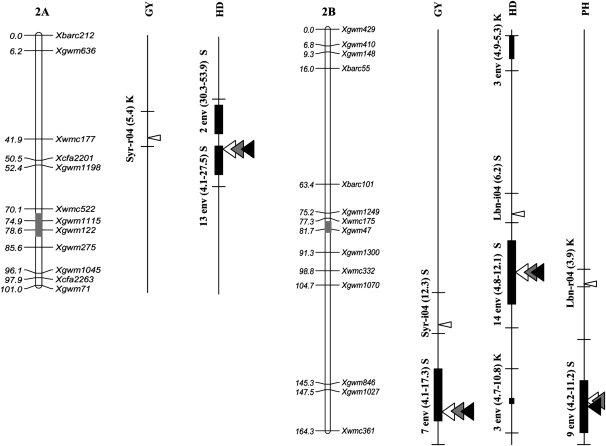
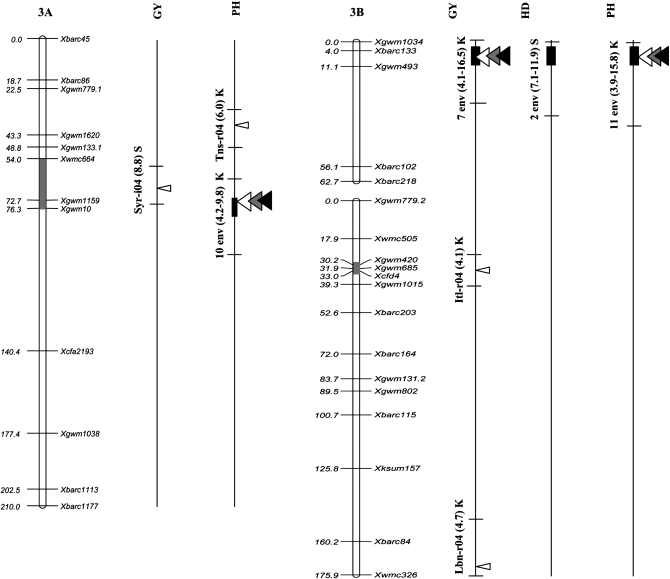
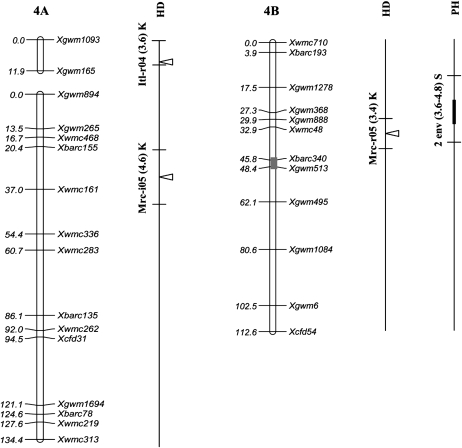
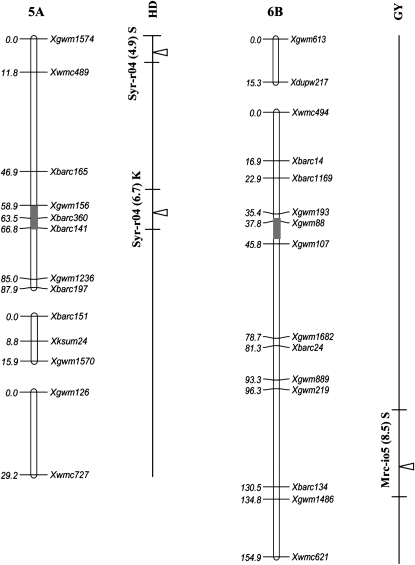
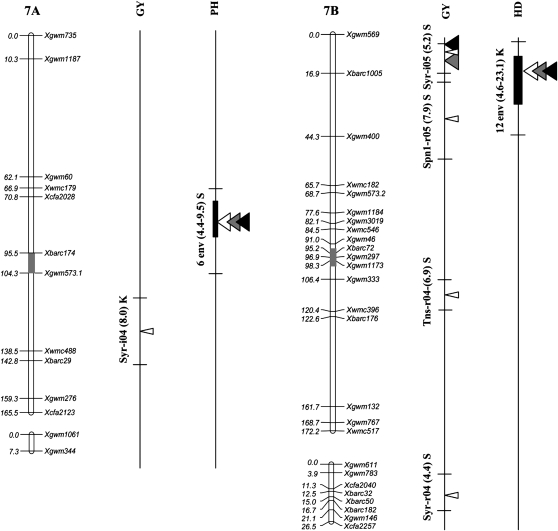
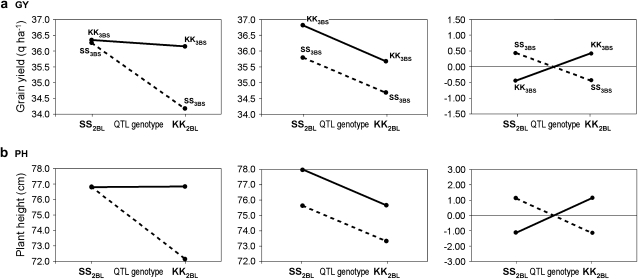
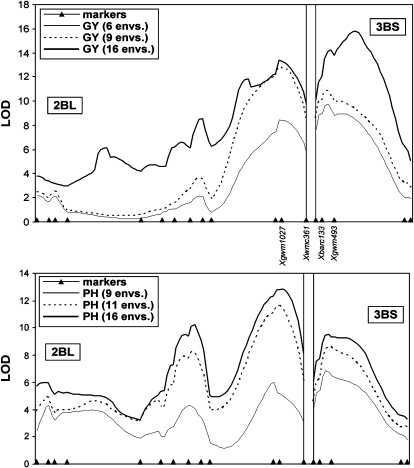
Grain yield is a major goal for the improvement of durum wheat, particularly in drought-prone areas. In this study, the genetic basis of grain yield (GY), heading date (HD), and plant height (PH) was investigated in a durum wheat population of 249 recombinant inbred lines evaluated in 16 environments (10 rainfed and 6 irrigated) characterized by a broad range of water availability and GY (from 5.6 to 58.8 q ha(-1)). Among the 16 quantitative trait loci (QTL) that affected GY, two major QTL on chromosomes 2BL and 3BS showed significant effects in 8 and 7 environments, with R2 values of 21.5 and 13.8% (mean data of all 16 environments), respectively. In both cases, extensive overlap was observed between the LOD profiles of GY and PH, but not with those for HD. QTL specific for PH were identified on chromosomes 1BS, 3AL, and 7AS. Additionally, three major QTL for HD on chromosomes 2AS, 2BL, and 7BS showed limited or no effects on GY. For both PH and GY, notable epistasis between the chromosome 2BL and 3BS QTL was detected across several environments.


Figures

F<sc>igure</sc> 1.—
Figure 1.—
Frequency distributions of grain yield (GY), heading date (HD), and plant height (PH) of the Kofa × Svevo RILs based on the mean values across 16 Mediterranean environments. Means for RILs, Kofa (K), and Svevo (S) are indicated with arrows.
F<sc>igure</sc> 2.—
Figure 2.—
Position of QTL detected in the Kofa × Svevo RIL mapping population, tested in 16 Mediterranean environments. The QTL with R2 value >1% detected with composite-interval mapping (CIM) analysis are shown. QTL peak positions are reported (from left to right) for grain yield (GY), heading date (HD), and plant height (PH). QTL identified in a single environment are indicated with narrow triangles, and QTL identified on the basis of the mean values of 2004, 2005, and both years (i.e., all 16 environments) are indicated with wide triangles (open, shaded, and solid triangles, respectively). Horizontal black bars indicate the (LOD − 1) supporting intervals of QTL. QTL found in two or more environments with LOD peaks within a 20-cM interval are indicated with vertical bars of three different thicknesses based on their R2 values. For QTL detected in single environments the environment code, the R2 value, and the parent contributing the increasing allele (Kofa, K; Svevo, S) are reported, while for QTL found in two or more environments, the number of significant environments, the range of R2 values, and the parent contributing the increasing allele are indicated.
F<sc>igure</sc> 3.—
Figure 3.—
Additive and epistatic effects for grain yield (GY) (a) and plant height (PH) (b) calculated on the data averaged across 16 environments. A two-marker model including Xgwm1027 for the QTL on chr. 2BL and Xbarc133 for the QTL on chr. 3BS was adopted. For each trait, from left to right the first diagram shows the mean phenotypic values observed at the four genotypic classes, the diagram in the center shows the phenotypic values expected under the additive model only, while the third diagram depicts the epistatic effects, which are either positive or negative, but equal in magnitude, under the unweighted model.
F<sc>igure</sc> 4.—
Figure 4.—
LOD score plots of the QTL × environment interaction (G × E) for grain yield (GY) and plant height (PH) in the chromosome regions harboring the two major QTL clusters (chrs. 2BL and 3BS). A G × E significance test was carried out for the combined analysis of the subset of environments showing significant QTL effects (LOD > 2.5) at both chromosome regions (thin line), of the subset of environments showing QTL effect (LOD > 2.5) in at least one of the two chromosome regions or in both of them (dashed line), and of all environments (thick line). The chromosome positions of the markers flanking the QTL peaks are shown.

Similar articles

Cited by

References

    1. Araus, J. L., T. Amaro, J. Casadeus, A. Asbati and M. M. Nachit, 1998. Relationships between ash content, carbon isotope discrimination and yield in durum wheat. Aust. J. Plant Physiol. 25: 835–842.
    1. Araus, J. L., G. A. Slafer, M. P. Reynolds and C. Royo, 2002. Plant breeding and drought in C-3 cereals: What should we breed for? Ann. Bot. 89: 925–940. - PMC - PubMed
    1. Araus, J. L., J. Bort, P. Steduto, D. Villegas and C. Royo, 2003. a Breeding cereals for Mediterranean conditions: ecophysiological clues for biotechnology application. Ann. Appl. Biol. 142: 129–141.
    1. Araus, J. L., D. Villegas, N. Aparicio, L. F. Del Moral, S. El Hani et al., 2003. b Environmental factors determining carbon isotope discrimination and yield in durum wheat under Mediterranean conditions. Crop Sci. 43: 170–180.
    1. Basten, C., B. S. Weir and Z.-B. Zeng, 2005. QTL Cartographer. North Carolina State University, Raleigh, NC. http://statgen.ncsu.edu/qtlcart/.

Publication types